# Reports and Dashboards
Beside the table listing and download option generally available in the OpenStudyBuilder application the system also supports NeoDash reports and dashboards.
# Open NeoDash
To open NeoDash reports:
- Click on the Reports button placed on the main OpenStudyBuilder page

- The NeoDash login page should be displayed
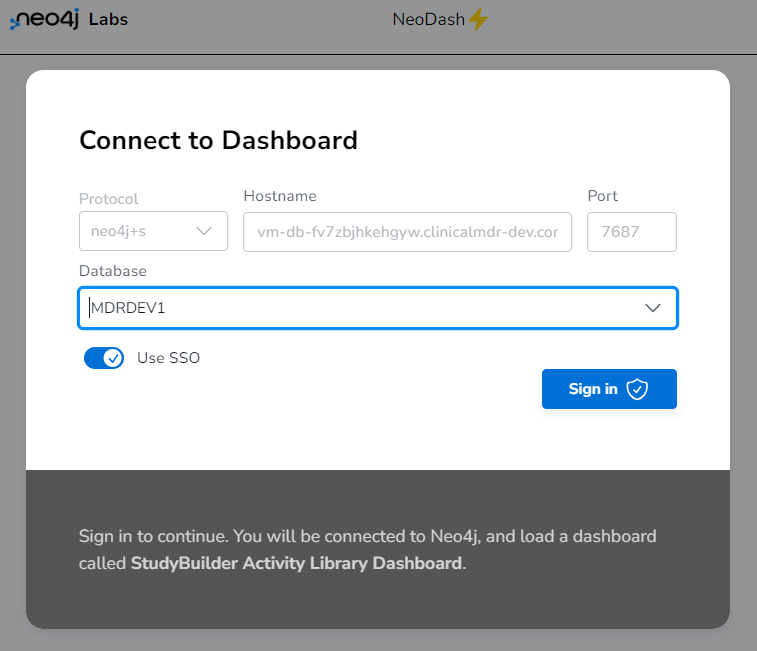
- Select to use 'SSO' and then click the 'Sign in' button.
Note: Select the database in which the neodash report is stored. Typically the mdr and not neo4j.
- If requested to select a browser account, select your Microsoft identity account you use for the application.
- The NeoDash report should open
Note: The URL to access the NeoDash report will follow this pattern, where text in '[ ]' is optional and italic text is replaced by environment specific values: [open]studybuilder[.environment].domain/neodash/
# Select Neodash report
In the lower left corner of the neodash window you will find the Expand  and Collapse
  icons for the left side navigation panel. Upon expanding the navigation panel, available neodash reports can be opened and reviewed.
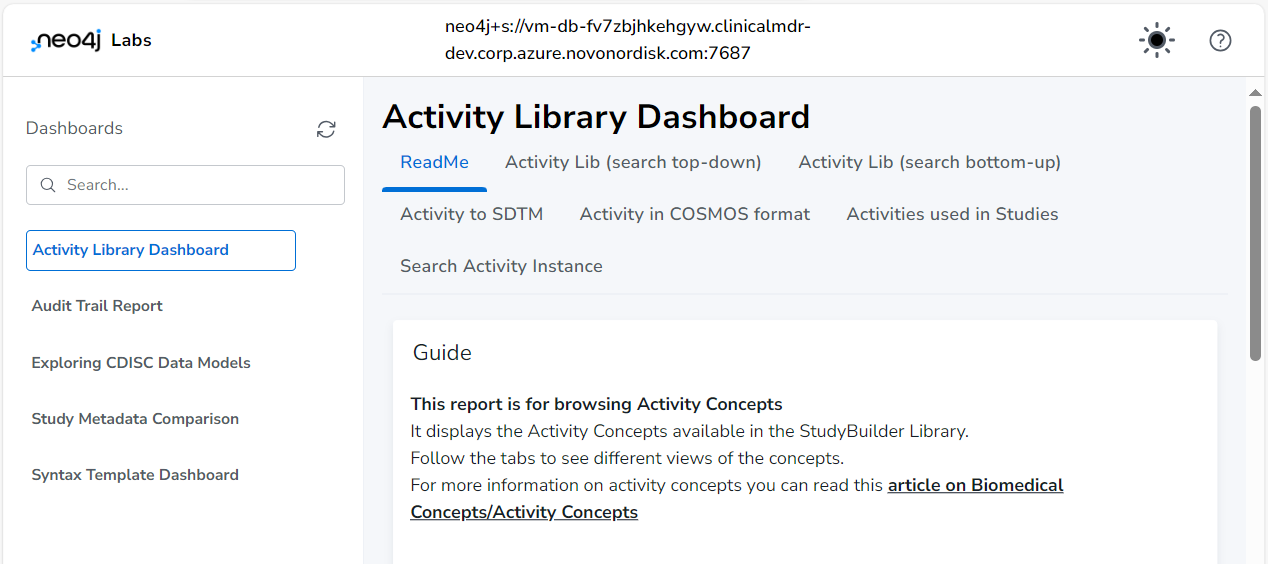
In the following sections the current neodash reports are briefly described, and the first tab of each report holds a short ReadMe instruction as well.
# Activity Library Dashboard
In addition to the Application, a Neo4j Dashboard is available to browse and understand biomedical concepts which are the activities in the OpenStudyBuilder.
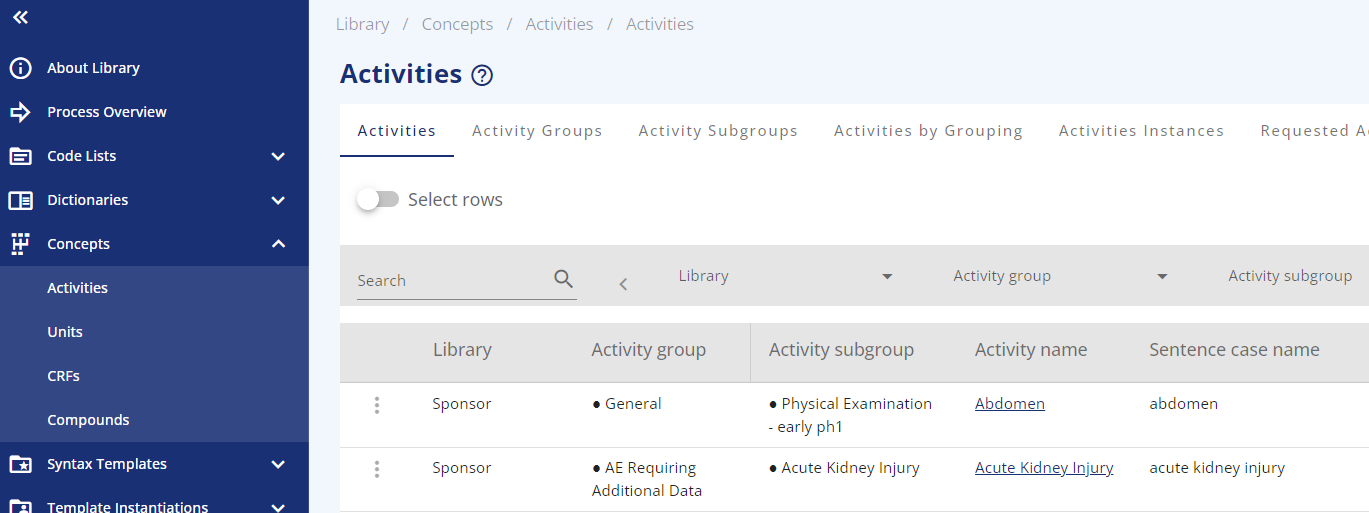
Within the OpenStudyBuilder application, you can define and see the activities in the "Library" -> "Concepts" -> "Activities" part.
The activities are managed in groups and subgroups. Whereas the "Activity" can be viewed as an "umbrella" that defines all general attributes, the "ActivityInstance" is the detailed specification of the logical observation. This includes reference to context and qualifier values. For example, the ActivityInstance includes references to ADaM BDS PARAM/PARAMCD or column name in ADSL, it also includes internal unique identification as well as internal topic code. This detailed specification will enable unique identification of source data, representation in SDTM by several qualifiers, and representation in ADaM BDS by PARAMCD value.
# Activity Dashboard
The activity dashboard is an option to view the activities from a different perspective. Especially when working with biomedical concepts from the OpenStudyBuilder and others like the CDISC CoSMOS, it might be valuable to have a database closer access as the dashboard provides. When you have access to the OpenStudyBuilder environment, see guide on how to open NeoDash in previous section.
The dashboard is organized in different tabs supporting different purposes.

ReadMe This tab provides a quick overview of the numbers of Activities and ActivityInstances.
Search top-down/bottom-up These two tabs are designed to navigate the "Activity Lib" either via a top-down or bottom-up search.
Activity to SDTM Then there is the option to view how Activities relate to SDTM using a specific implementation guide.
Activity in COSMOS format As the CDISC collaboration with the CoSMOS initiative is very important, there is also a mapping of activities in the OpenStudyBuilder to the CDISC CoSMOS format.
Activities used in studies An overview of the activity usage in studies. It shows which activities are being used in a study by visit. This view is preliminary and will be expanded with more study details.
Search Activity Instance This is a page for searching directly from ActivityInstance level.
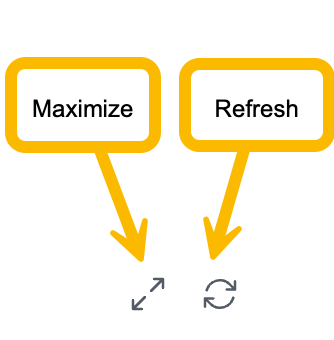
Basic dashboard features In the panels there are options to expand/maximize and to refresh
# Introduction / ReadMe
The first dashboard page gives an overview of activities, their grouping and the types including counting statistics.
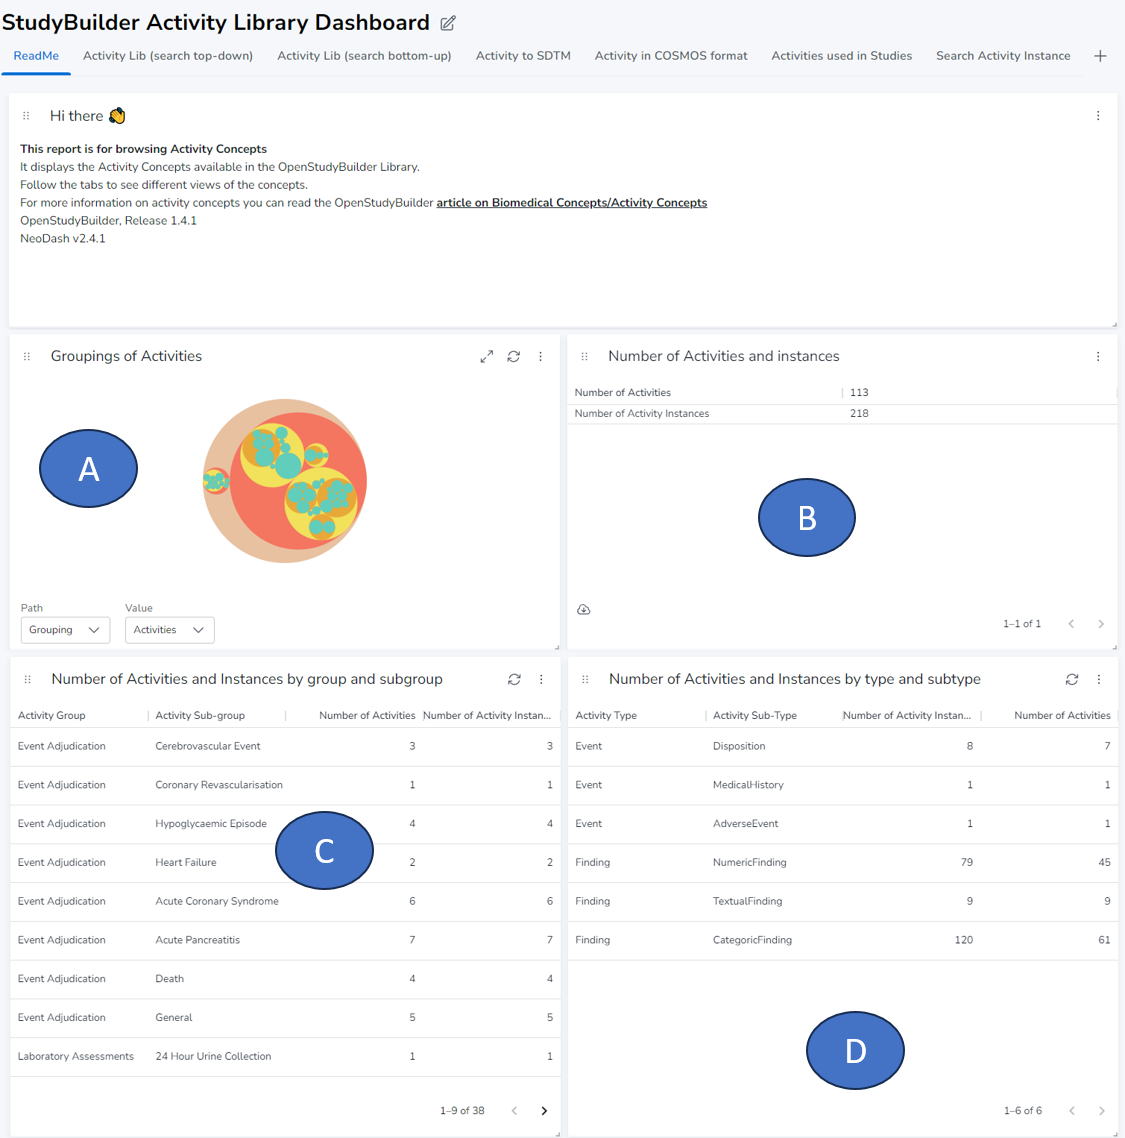
The first graphic (A) shows the "Groupings of Activities" as a circle-packing, which shows the available types and sub-types. To drill-down click on one of the circles. To get back click on the refresh icon in the top-right corner of the panel.
Next to this, there are the numbers of activities and instances (B). An instance is the specific definition of an observation which is used in studies. The table for "Number of Activities and Instances by group and subgroup" (C) can be used to get an overview of the groups and subgroups whereas the table "Number of Activities and Instances by type and subtype" shows the overview with type and sub type (D).
# Activity Lib (search top-down)
The second tab allows you to look at activities from the top-down perspective. You can browse the class and sub-class followed by the group and subgroup.
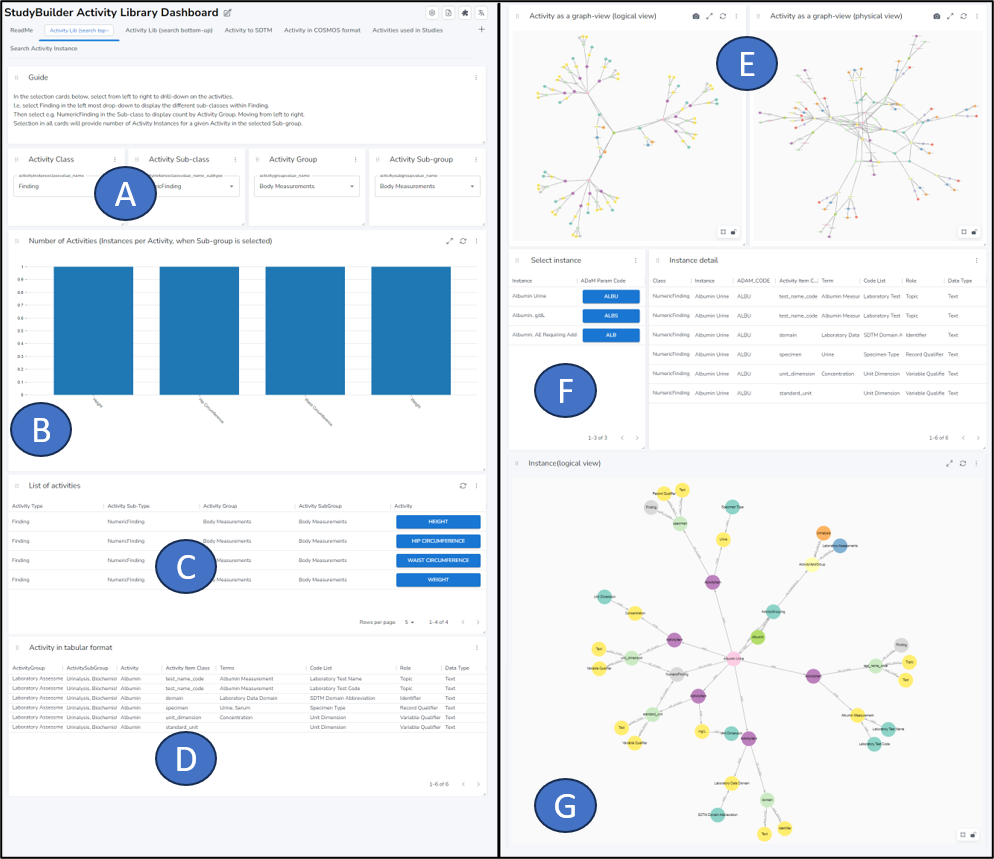
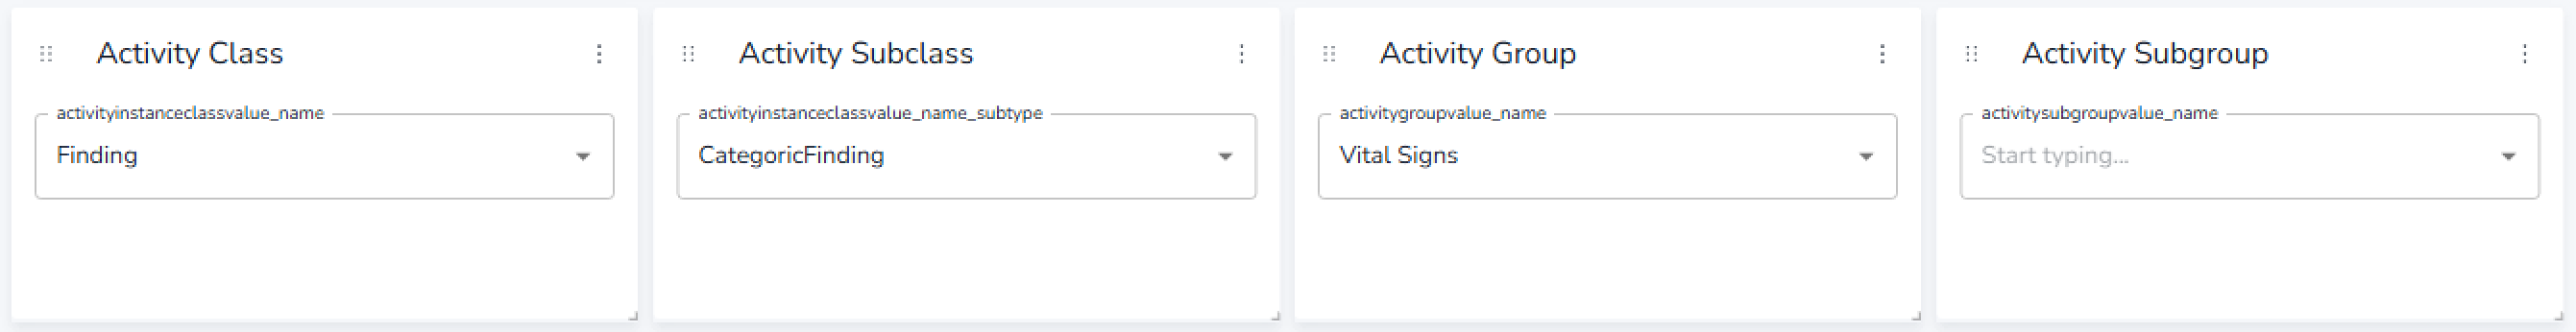
The description section in the top of the page provides a short guide to the selection panel below. Start typing from the left-most panel and move toward the right side.
In the selection area (A) a class is provided (fx Findings, Events, Interventions) to narrow down the list of Activities. Then the sub-class is provided (fx Numeric Finding, Categoric Finding etc), group and finally sub-group.
Note: specifying a sub-group will display all the individual activities in the histogram as individual bars. The height of the bar indicates the number of instances for the activity.
The "Number of activities" histogram (B) updates with the concrete numbers when you filter the activities.
Depending on your selection in filter (A), the "List of activities" (C) lists the activities matching your filter. When clicking one concrete activity, the details of this activity are displayed (D).
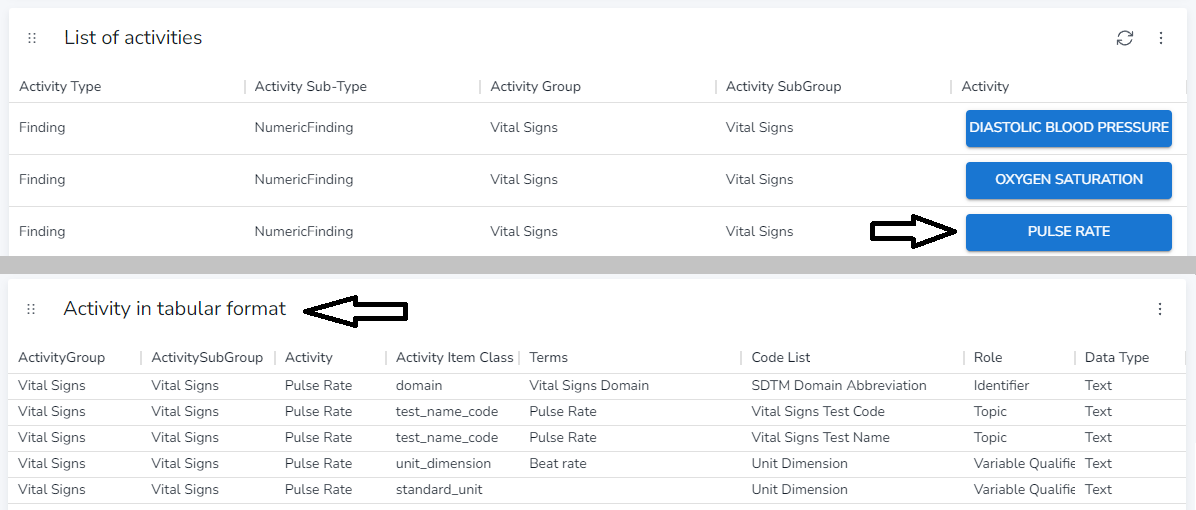
We can see that the PULSE RATE has an associated domain, a test_name_code which consists of a code and a name, a unit_dimension and a standard_unit.
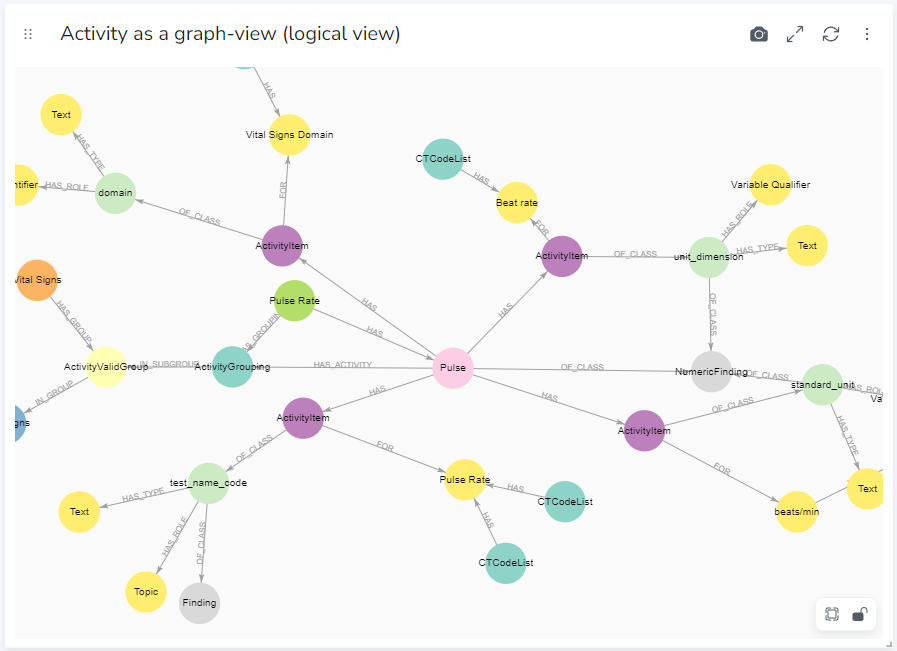
Below we can see the representation of that activity as in the graph database in the logical view or physical view (E). The complex model enables us to link all information. The following screenshot shows the logical view for PULSE RATE.
The last part displays information about concrete activity instances. There is the selection part (F) and the display as logical view part (G).
When we select for example ALBUMIN as activity, it could have three different instances depending on the purpose of activity collection.
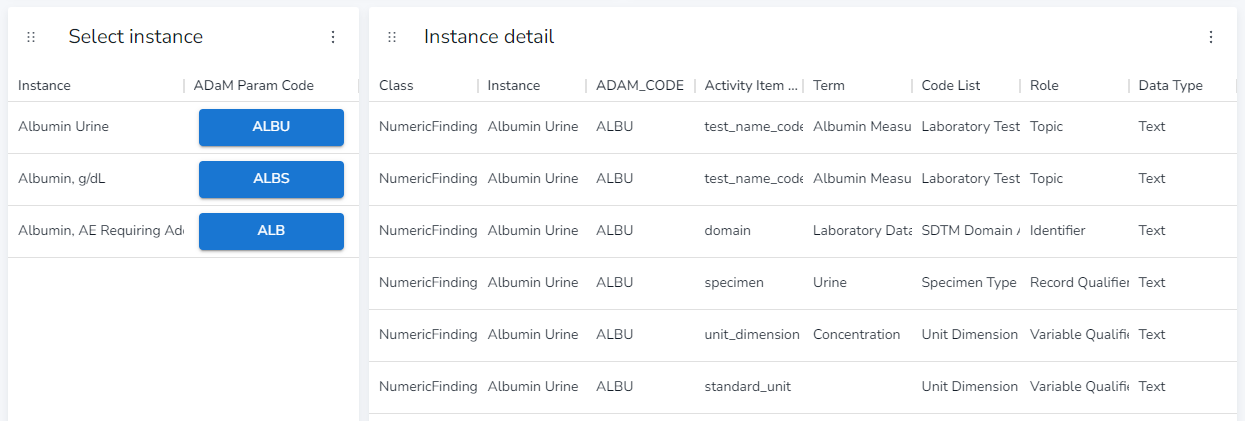
There is an instance for "Albumin Urine", where the specimen is "Urine", the second instance is for the specimen "Serum" and the third one is collected differently with the purpose for "AE Requiring Additional Data".
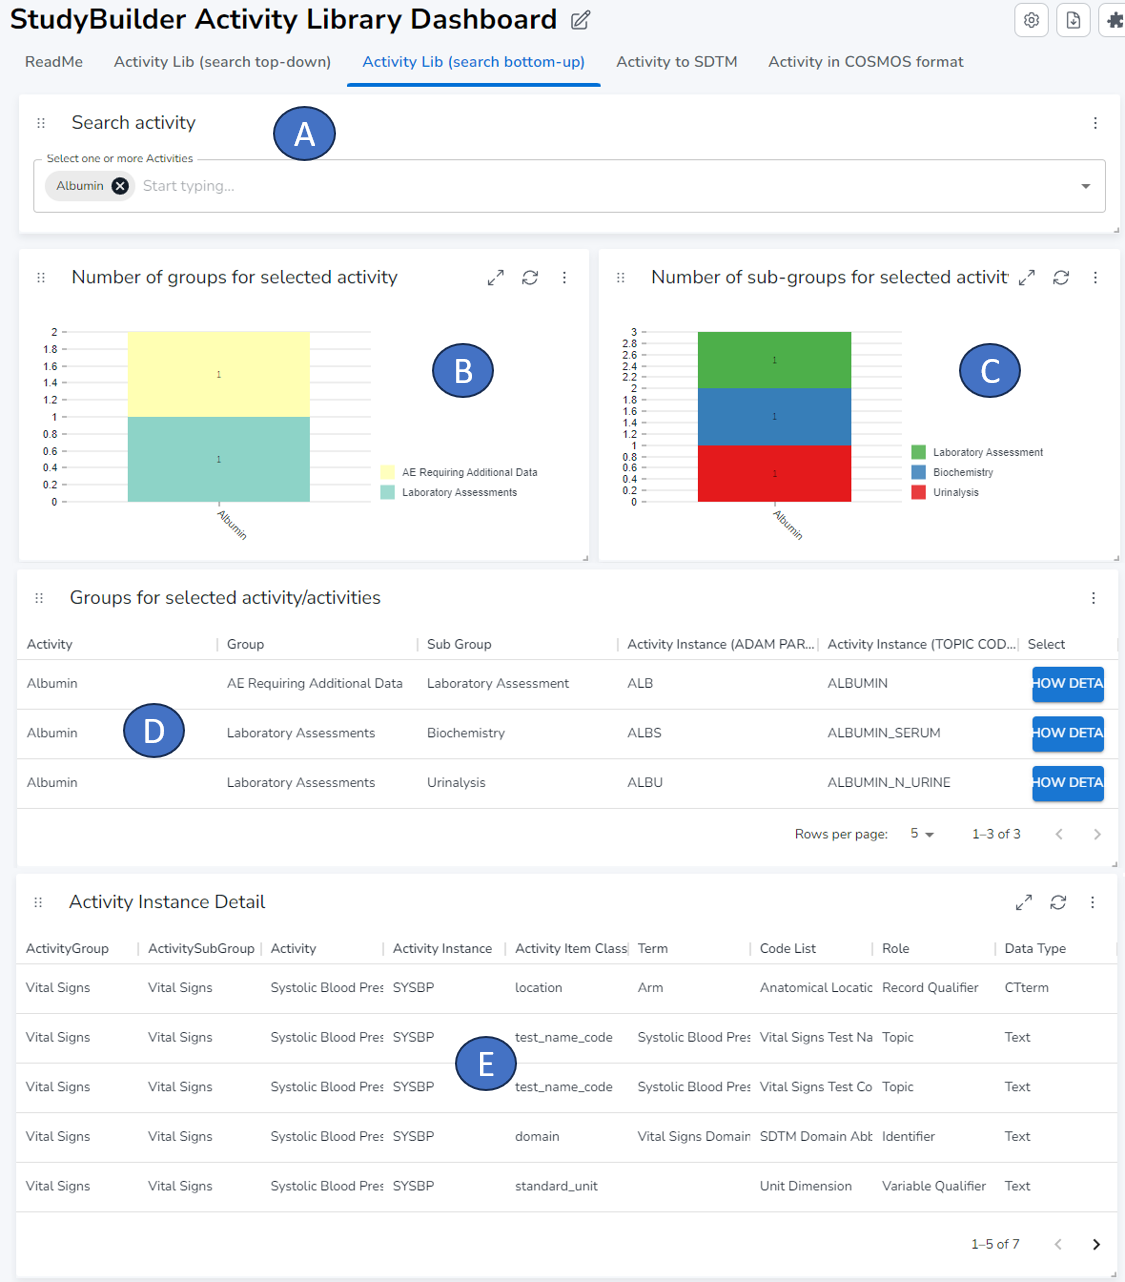
# Activity Lib (search bottom-up)
The search bottom-up tab enables you to search for one or more activities in the search field (A) and get an overview of the groups (B) and sub-groups (C) the selected activities belong to. In (D) you can select the activity belonging to the group and sub-group of interest and have its details displayed in (E).
# Activity to SDTM
The "Activity to SDTM" tab provides a detailed view of how activities are linked to specific SDTM items within a particular implementation guide. This feature allows you to visualize the relationship between activities and SDTM items, enhancing your understanding of the data structure.
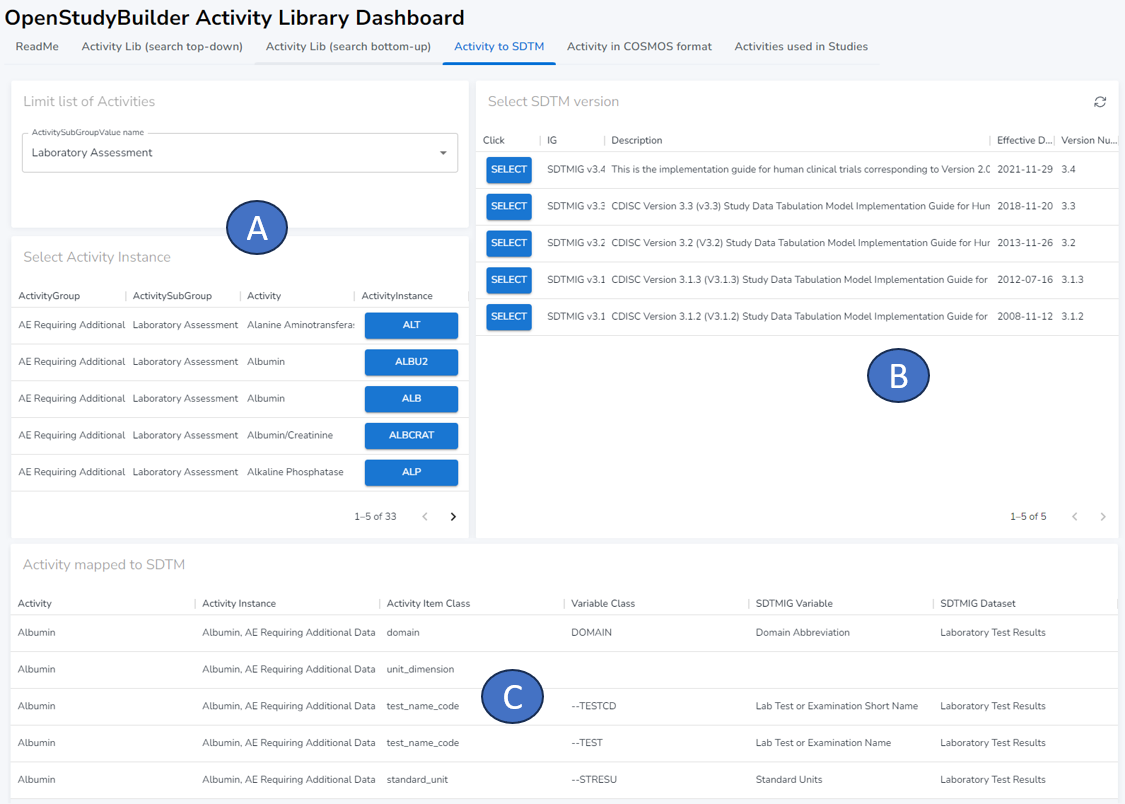
The dashboard has a 1000 row limitation to display, so to limit the number of activity instances, you can select the activity sub-group and the corresponding activity instance belonging to the selected sub-group are listed in (A). Given that SDTM standards evolve over time, item definitions and structures may change. Therefore, you have the option to select a specific implementation version (B). Once selected, the mapping as defined in the implementation guide is displayed (C). Please note that for some activities, the mapping may not yet be available in the database. In such cases, the mapping will not be displayed until it is added.
# Activity in COSMoS format
In an effort to standardize and streamline the representation of Biomedical Concepts, CDISC initiated the Conceptual and Operational Standards Metadata Services (COSMoS) project in 2022. More details about this project can be found on their homepage. As part of this initiative, CDISC has adopted the YAML format for displaying biomedical concepts.
Our dashboard has been designed to align with this standard. It can map the activities defined in OpenStudyBuilder into a valid COSMoS format, ensuring compatibility and interoperability with other systems that adhere to the same standard.
The following section presents an example of how the activity instance "TEMPERATURE" is represented in the COSMoS format.
category:
  - Vital Signs
dataElementConcepts:
  - dataType: string
    conceptId: C44276
    exampleSet:
      - TEMPERATURE
    shortName: unit_dimension
    href: https://ncithesaurus.nci.nih.gov/ncitbrowser/ConceptReport.jsp?dictionary=NCI_Thesaurus&ns=ncit&code=C44276
  - dataType: string
    conceptId: C82587
    exampleSet:
      - C
    shortName: standard_unit
    href: https://ncithesaurus.nci.nih.gov/ncitbrowser/ConceptReport.jsp?dictionary=NCI_Thesaurus&ns=ncit&code=C82587
  - dataType: string
    conceptId: C25341
    exampleSet:
      - SKIN
    shortName: location
    href: https://ncithesaurus.nci.nih.gov/ncitbrowser/ConceptReport.jsp?dictionary=NCI_Thesaurus&ns=ncit&code=C25341
packageType: bc
definition: A measurement of the temperature of the body.
synonym:
  - TEMP
  - Temperature
resultScale:
  - Quantitative
conceptId: C174446
domain: VS
parentConceptId: C25206
shortName: Body Temperature
href: https://ncithesaurus.nci.nih.gov/ncitbrowser/ConceptReport.jsp?dictionary=NCI_Thesaurus&ns=ncit&code=C174446
packageDate: 2023-04-30
Note: As the report is accessing NCI terminology via API it may run for a bit before the yaml structure is displayed.
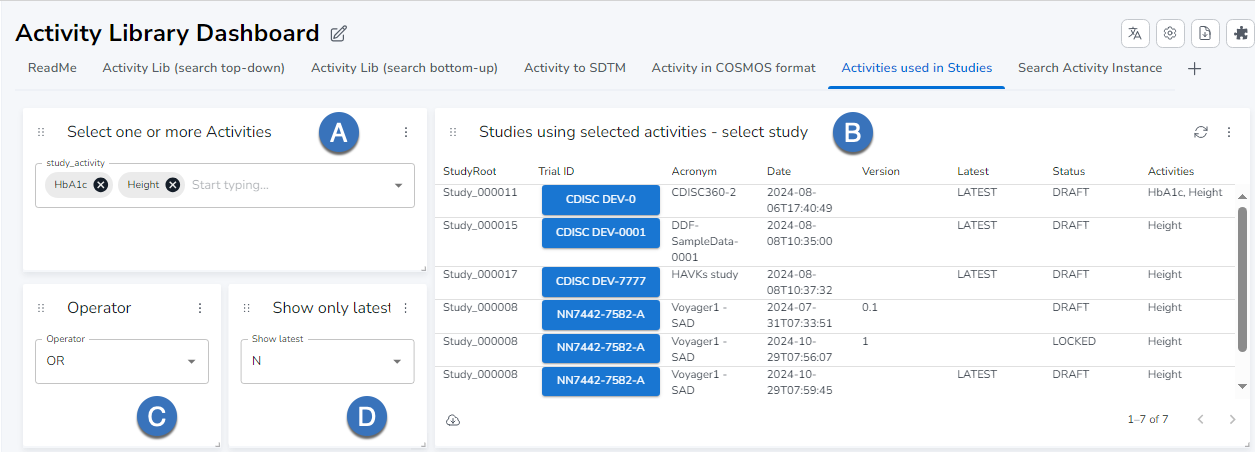
# Activities used in Studies
This provides a view of where specific activities are utilized across different studies. This feature allows you to track the usage of activities.
In the selection box (A), you can choose one or more activities. Upon selection, the dashboard dynamically displays the studies in which these activities are used (B). Selecting AND or OR in the operator (C) will allow for AND or OR in the search for more than one Activity and change the list displayed in (B). The Y or N in (D) will allow for the study list only to show the latest version of the study or show all versions. Select a study by clicking the Trial ID blue button in (B).
The study details will be displayed in the panels (E-H)
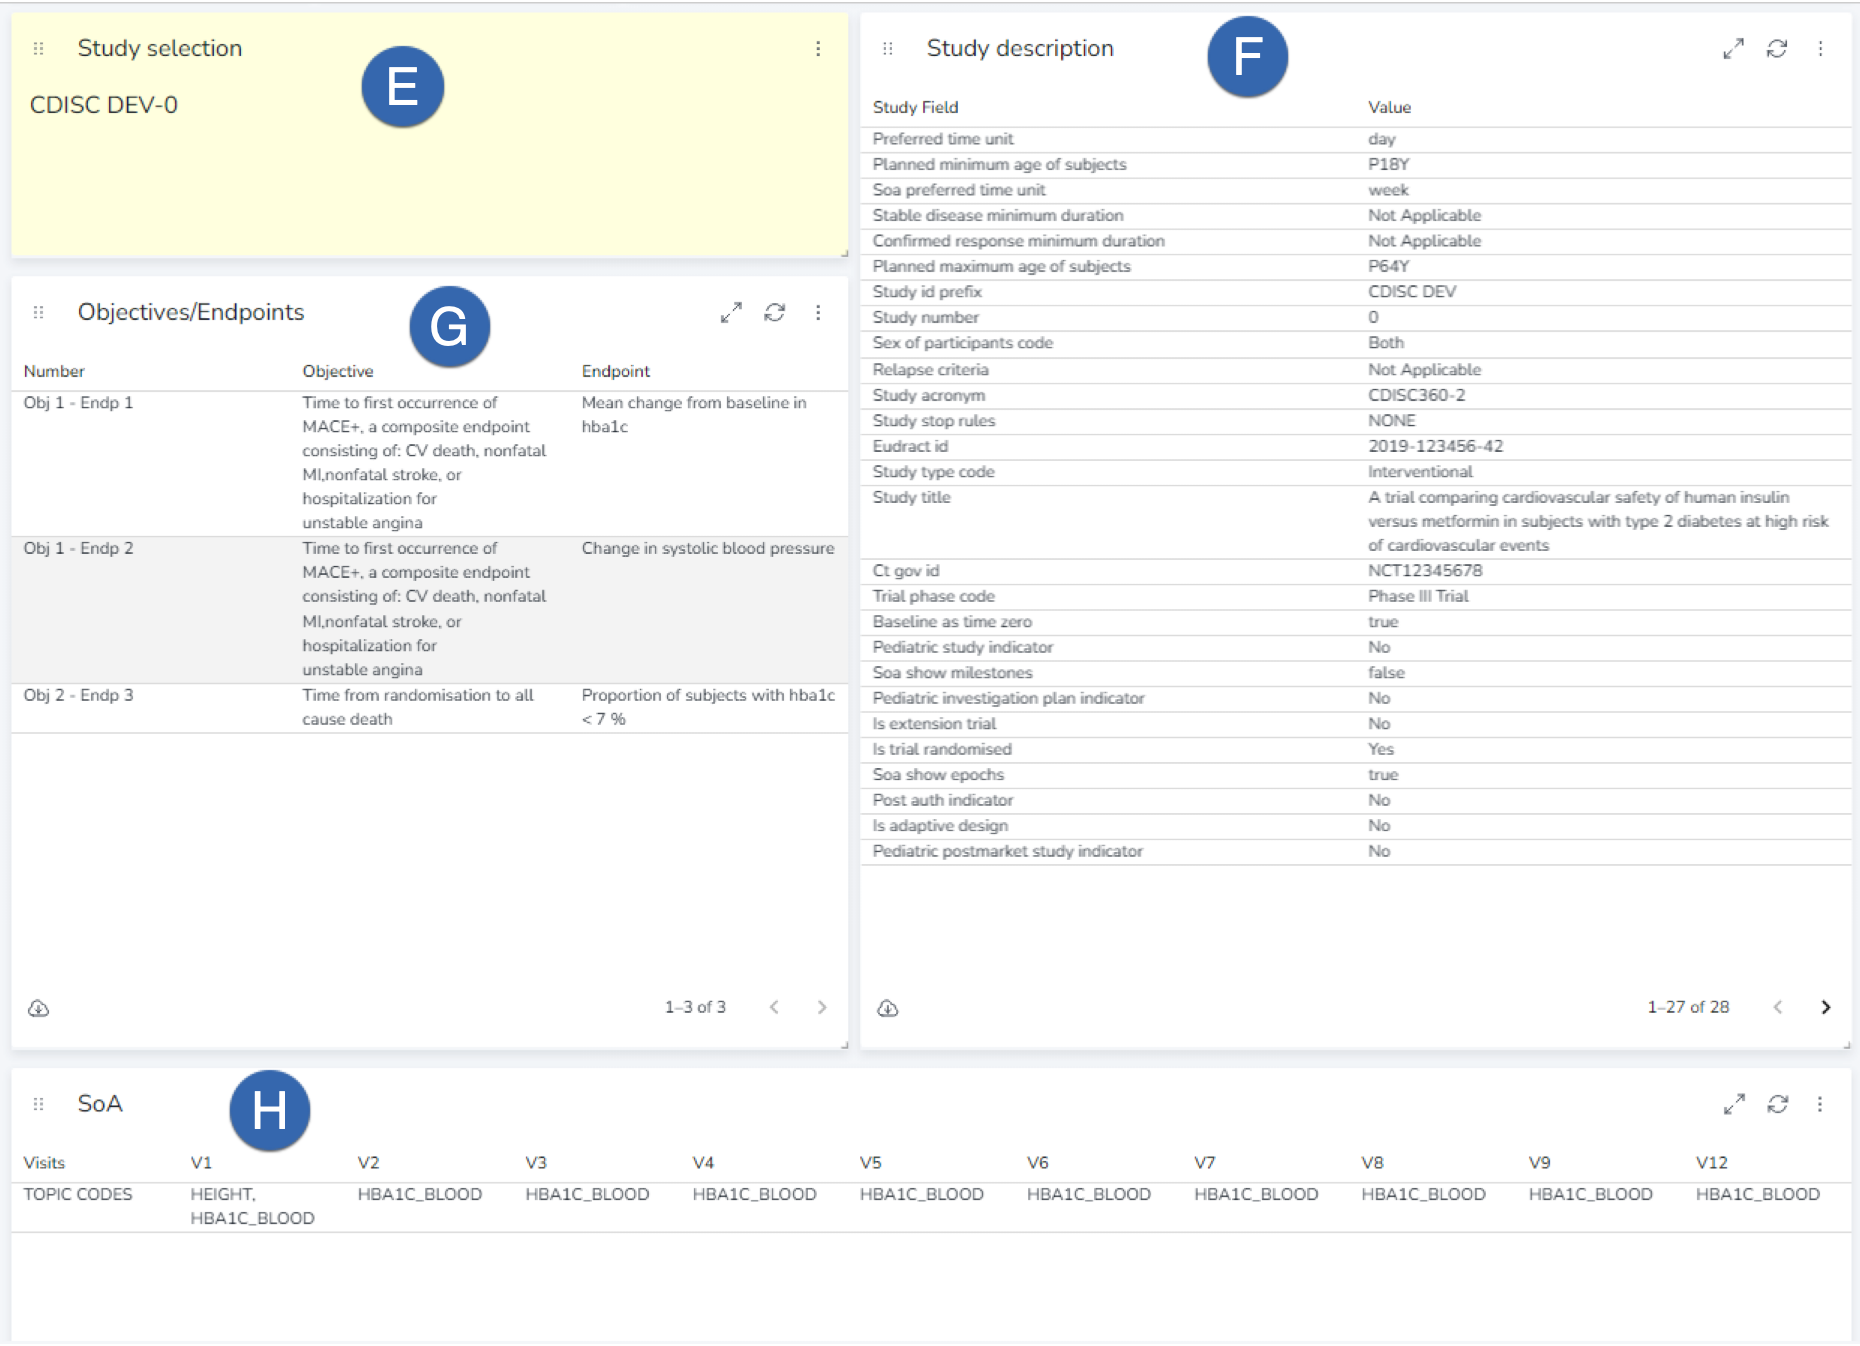
The panel (E) displays the study being selected in (B). The panel in (F) displays the overall study descriptions. The panel in (G) displays the study objectives and the panel (H) displays at which visits the selected activities occur (displayed by the Activity Instance topic code selected in the SoA).
# Search Activity Instance
This view provides a quick way to display details of one or more activity instances without having to specify the activity.
# Audit Trail Report
The Audit Trail Report can be used to browse the audit trail information from the database. The OpenStudyBuilder system is based on a linked graph database, and the audit trail system is an integrated part of how the versioning is supported, see more in Versioning and Audit Trail
The report has beside the ReadMe tab two main sections:
- Library Audit Trail for browsing history of changes across all library elements.
- In the library part you can filter and search by a specific user, start date and/or end date.
- In the library part you can filter and search by a specific user, start date and/or end date.
- Study Audit Trail for browsing history of changes across all study definitions.
- In the study part you can additionally select a study uid.
The audit trail report lists:
- initial entry and changes (value before and after change was made).
- what was changed (field and data identifiers).
- by whom a change was made (user, role and organisation).
- when a change was made (time stamp including date).
- why a change was made (reason for change in a GCP compliant manner for library elements).
- Note, for study definitions reason for change is captured for a complete locked study and can be browsed under study versioning.
NOTE: The audit trail report is not a good tool for viewing changes to a specific component in the database. Here the History pages within the OpenStudyBuilder pages will provide a better overview.
# Data Exchange Data Models
The Data Exchange Data Models report can be used to browse both CDISC defined data models, Sponsor extensions to CDISC data models as well as sponsor defined data exchange data models. This can be e.g. the CDISC SDTMIGs, sponsor extended SDTMIGs and e.g. file-based lab data exchange data MODELS.
Note: the data exchange data model dashboard is experimental and an initial version, additions and improvements will come in the next release.
Beside the ReadMe tab the report holds the following tabs:
- Catalogues Exploring overviews of data models in a graphical display.
- Models Select data model, version, and general domain class, browse variable classes and use in dataset classes.
- Implementation Guides - Excl. CDASH select implementation guide, version, and dataset, browse variables and extended sponsor model attributes.
- Sponsor Models select SDTM sponsor model version and dataset and browse extended variable attributes as well as selecting dataset classes and browsing extended variable class attributes.
- Implementation Guides - CDASH select CDASHIG, versions and datasets, browse variable attributes.
# Study Metadata Comparison
The Study Metadata Comparison report can be used to compare content between two specific studies, or between two versions of a study.
In addition to the ReadMe tab, the report includes a tab for study selection, followed by six sections, each displaying the differences within an area of the study specification.
On the Select studies tab you can:
- Select the option to only display differences, or all content of the two compares.
- You can filter on the projects to limit the study list (multi selection is enabled here).
- Then select the base study and version of the compare.
- Next select the study and version for the compare.
- The selected studies and version info is then displayed here as well as on the header card on each of the compare tabs.
The following six tabs display the compare result for:
- Study fields which provides comparison of simple study selections and values from study title, registry identifiers, study properties, study criteria.
- Objectives/Endpoints which compares objectives and the related endpoints
- Criteria which compares inclusion, exclusion, run-in, randomisation, dosing and withdrawal criteria.
- Planned visits which compares visits and the individual visits details.
- Collections which compares the planned activities the 'X's in the in the schedule of activity (SoA).
- Activities which compares the selected activities for the SoA and how they are organised within the SoA.
# Select studies
On the select studies page
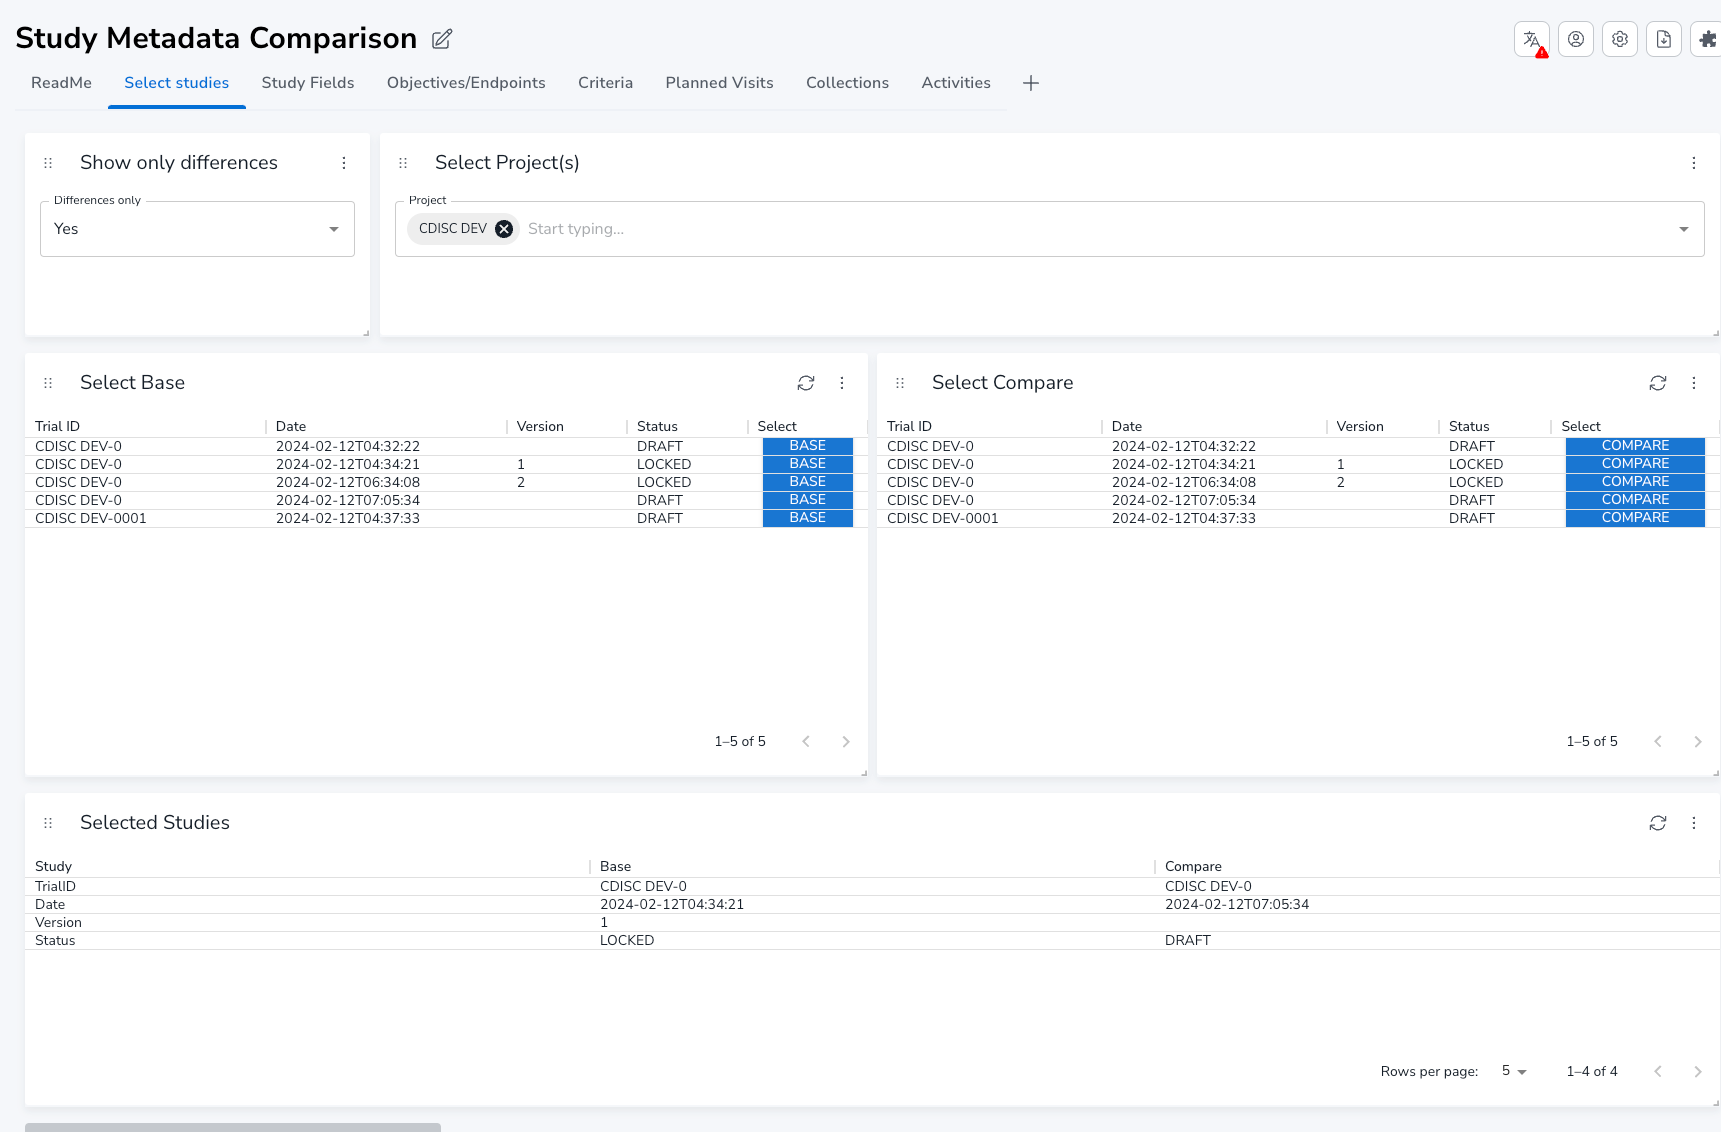
you can
- select to show differences only or not (Yes/No). Default is set to Yes.
- Limit the list of studies by selecting one or more projects.
- Select the Base study
- Select the Compare study
- View the selection. This panel will be repeated in the other tabs.
# Study fields
On the Study fields tab, the list of differences in various study fields are displayed.
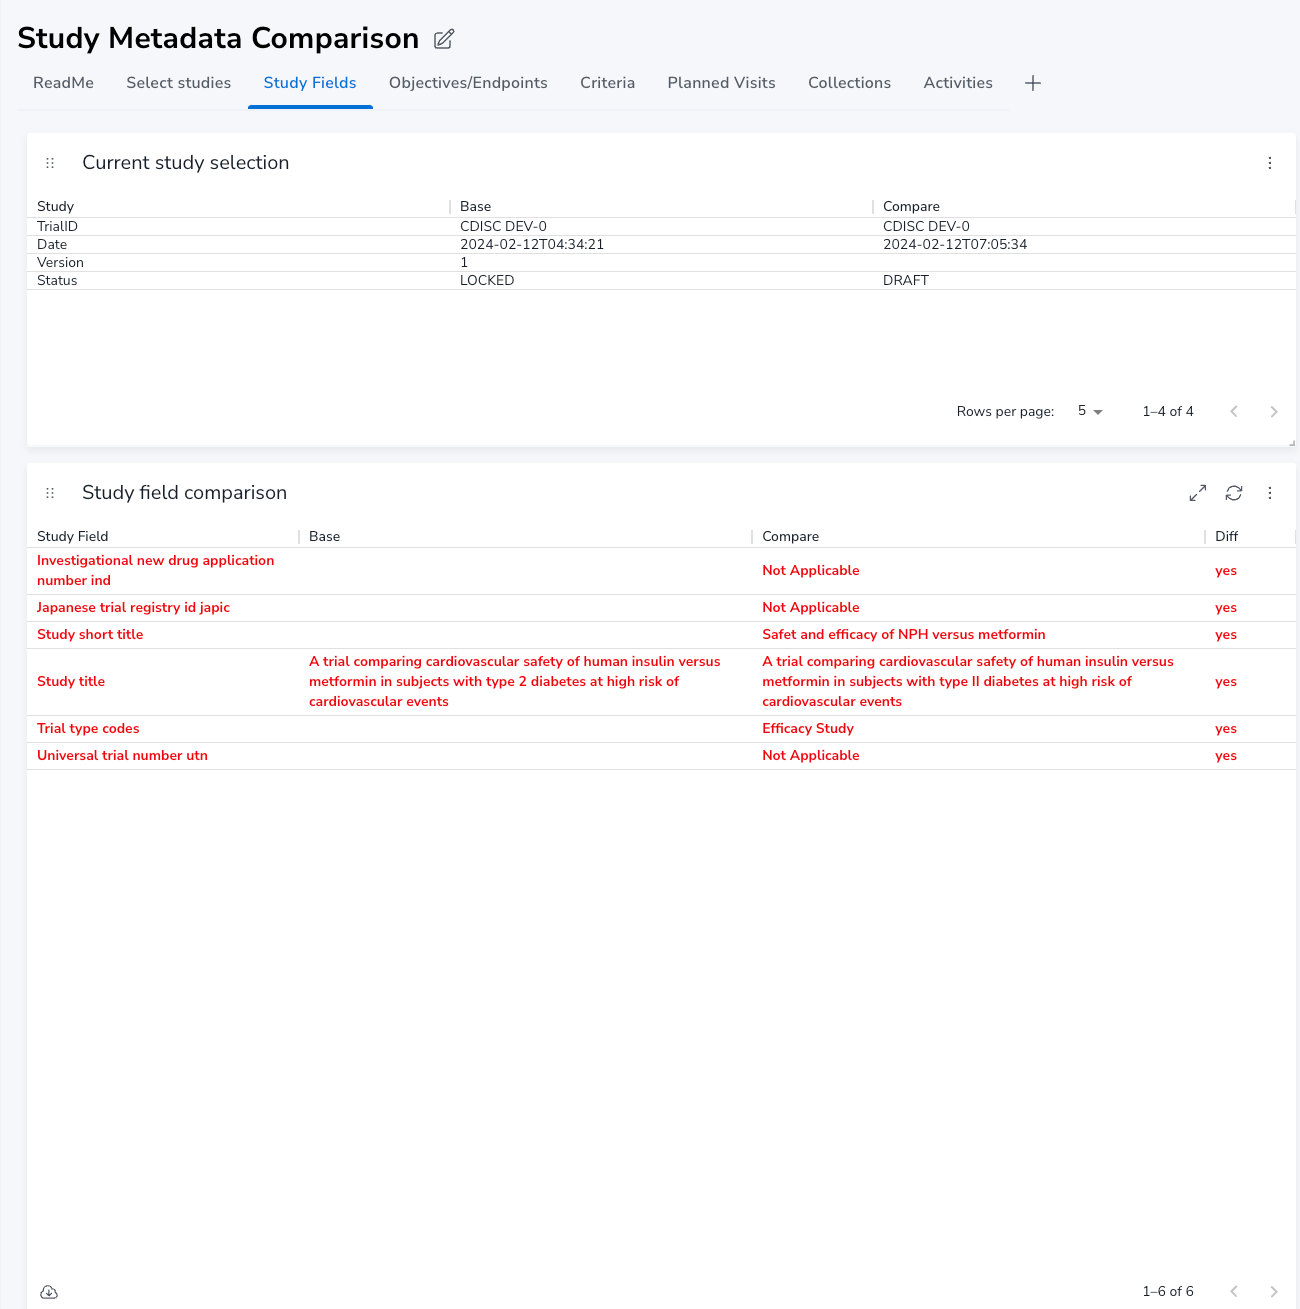
If you choose 'Differences Only' as 'No' on the Select studies tab then also similarities are displayed
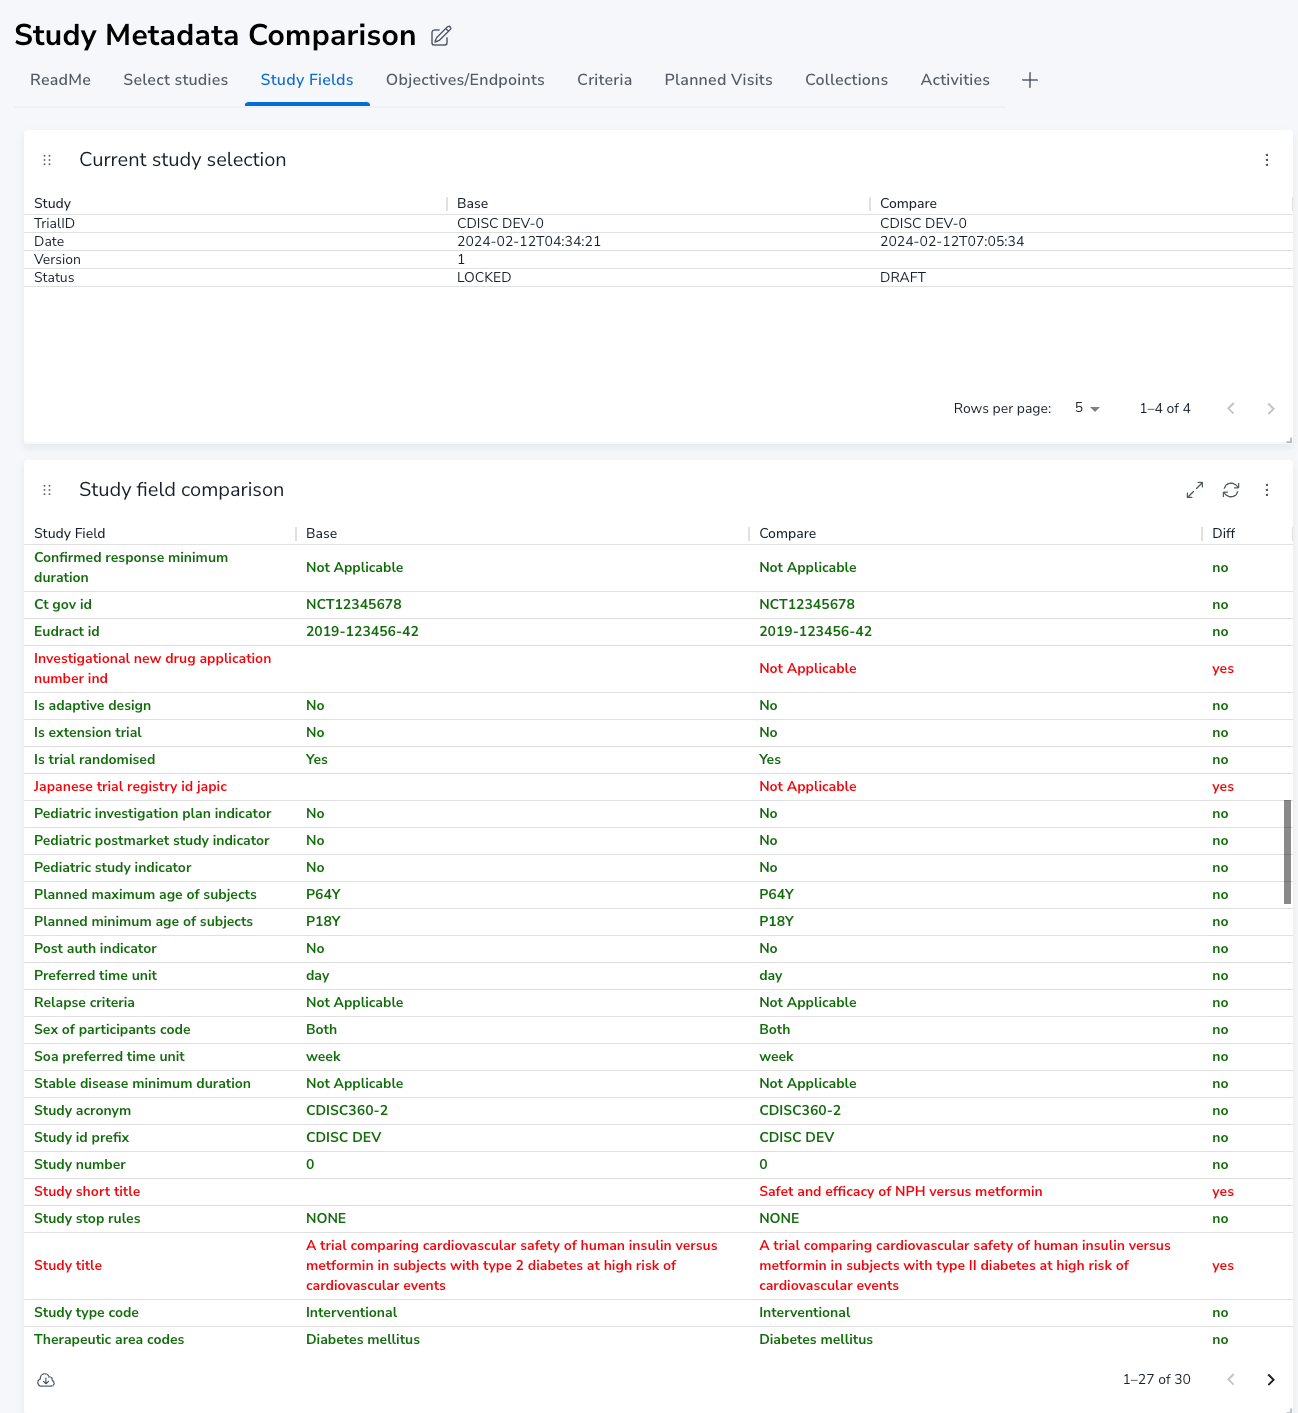
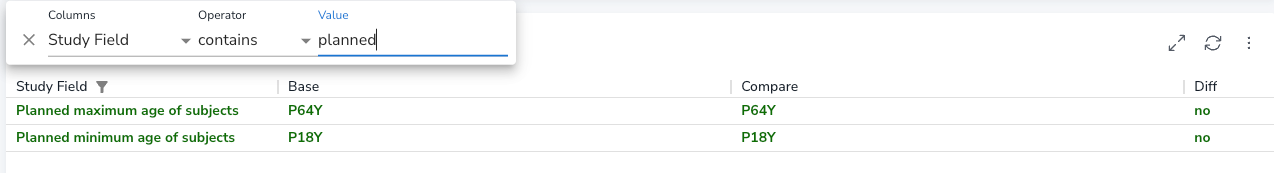
To filter on a specific study field, you can filter on the Study Field column
# Objectives/Endpoints
On the Objectives/Endpoints tab, the differences in Objectives and endpoints are listed
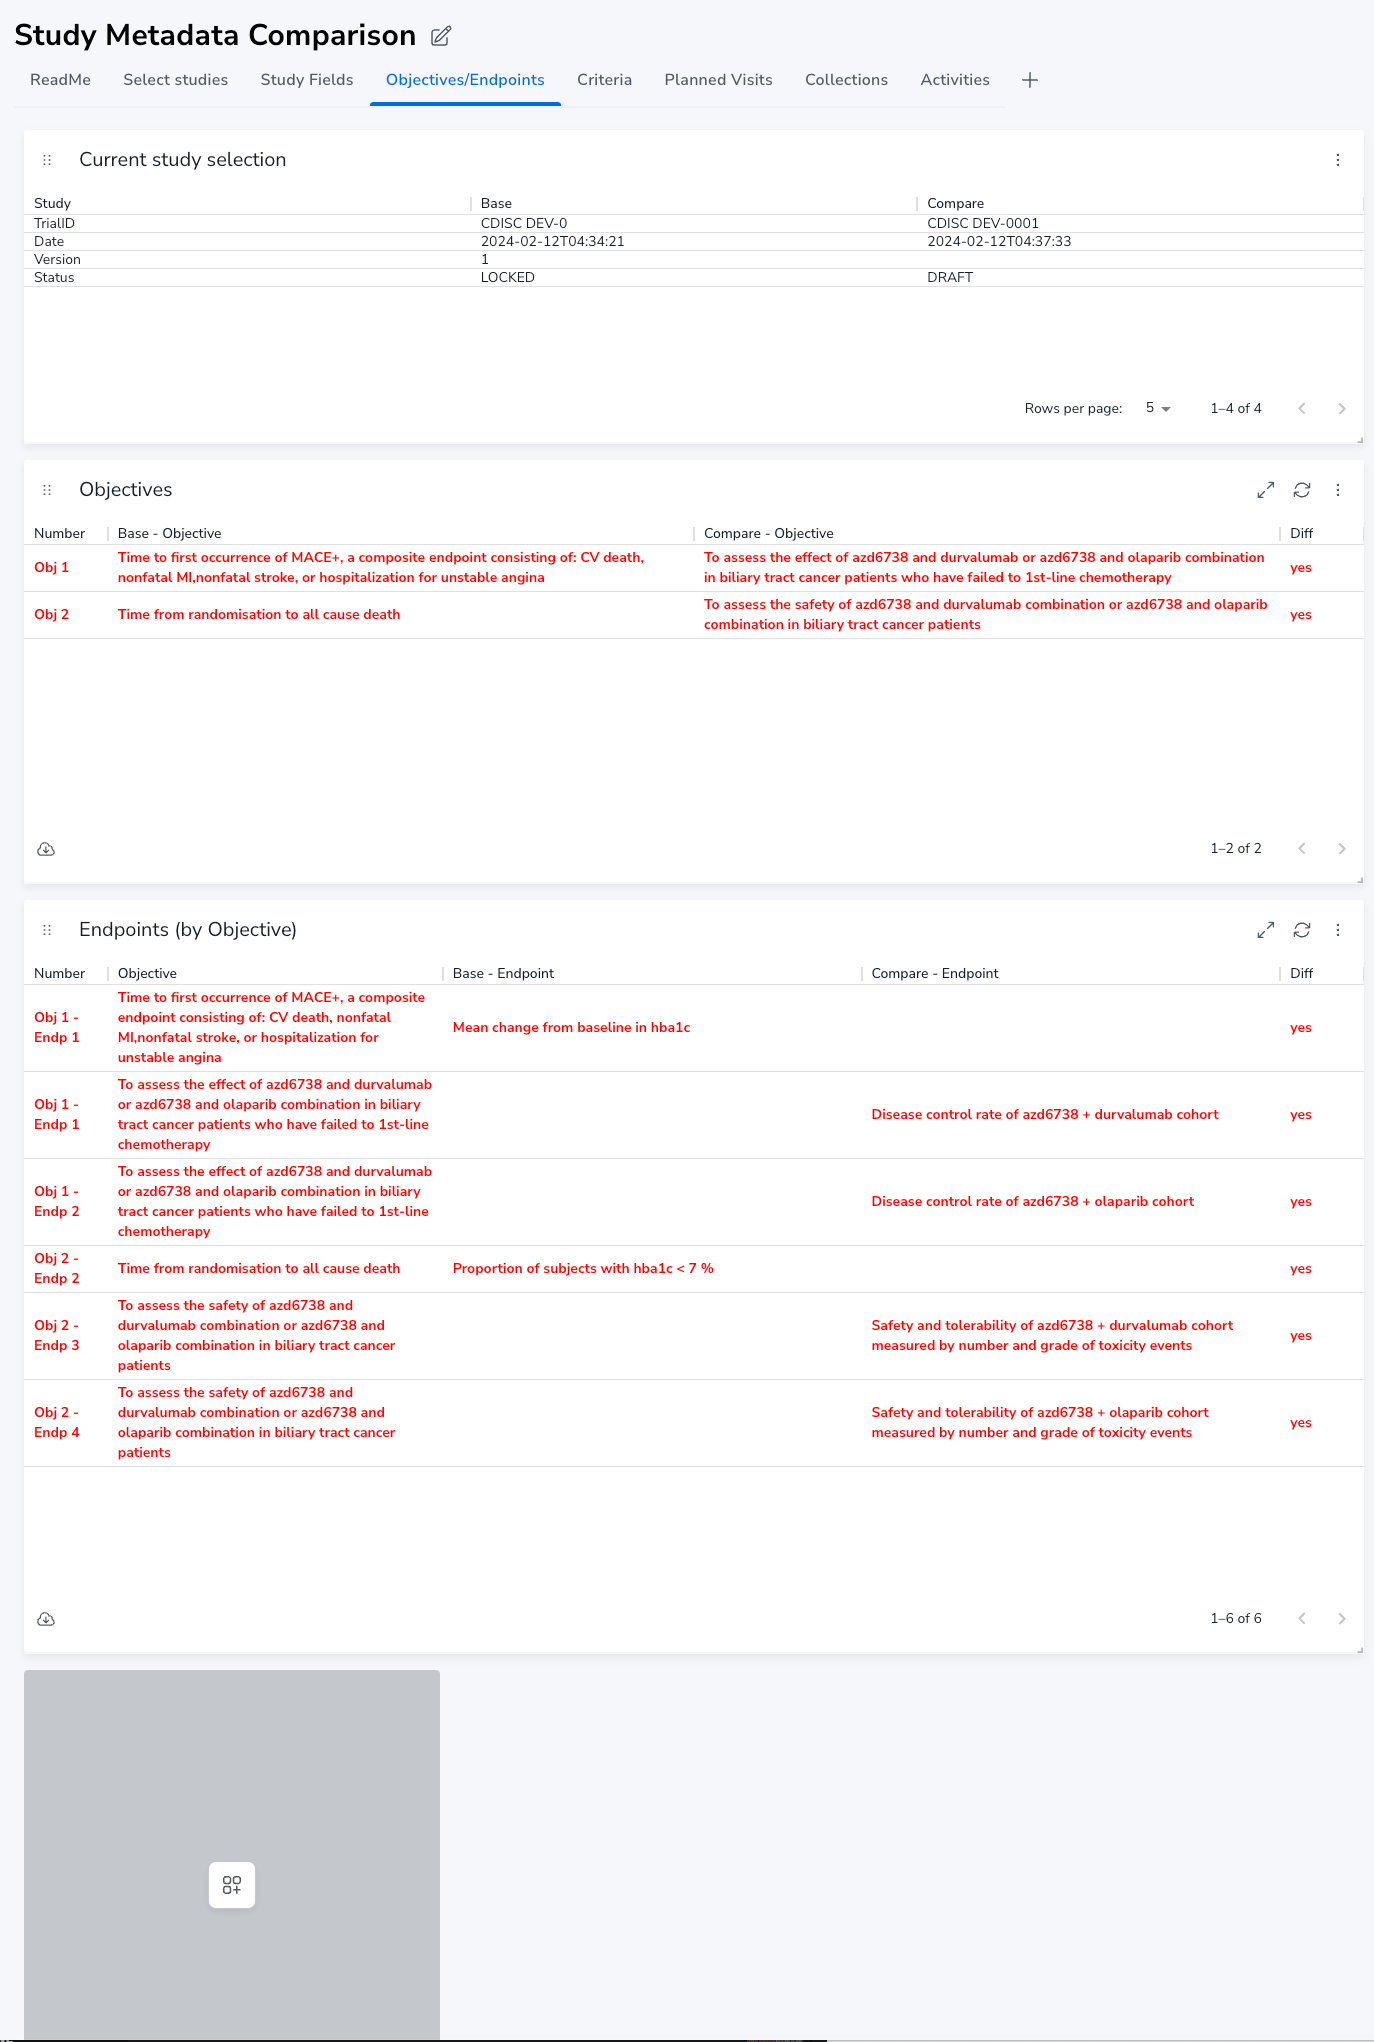
To show similarities, you need to select 'Differences Only' as 'No' on the Select studies tab.
# Criteria
On the Criteria tab, the differences in Inclusion and Exclusion criteria are listed
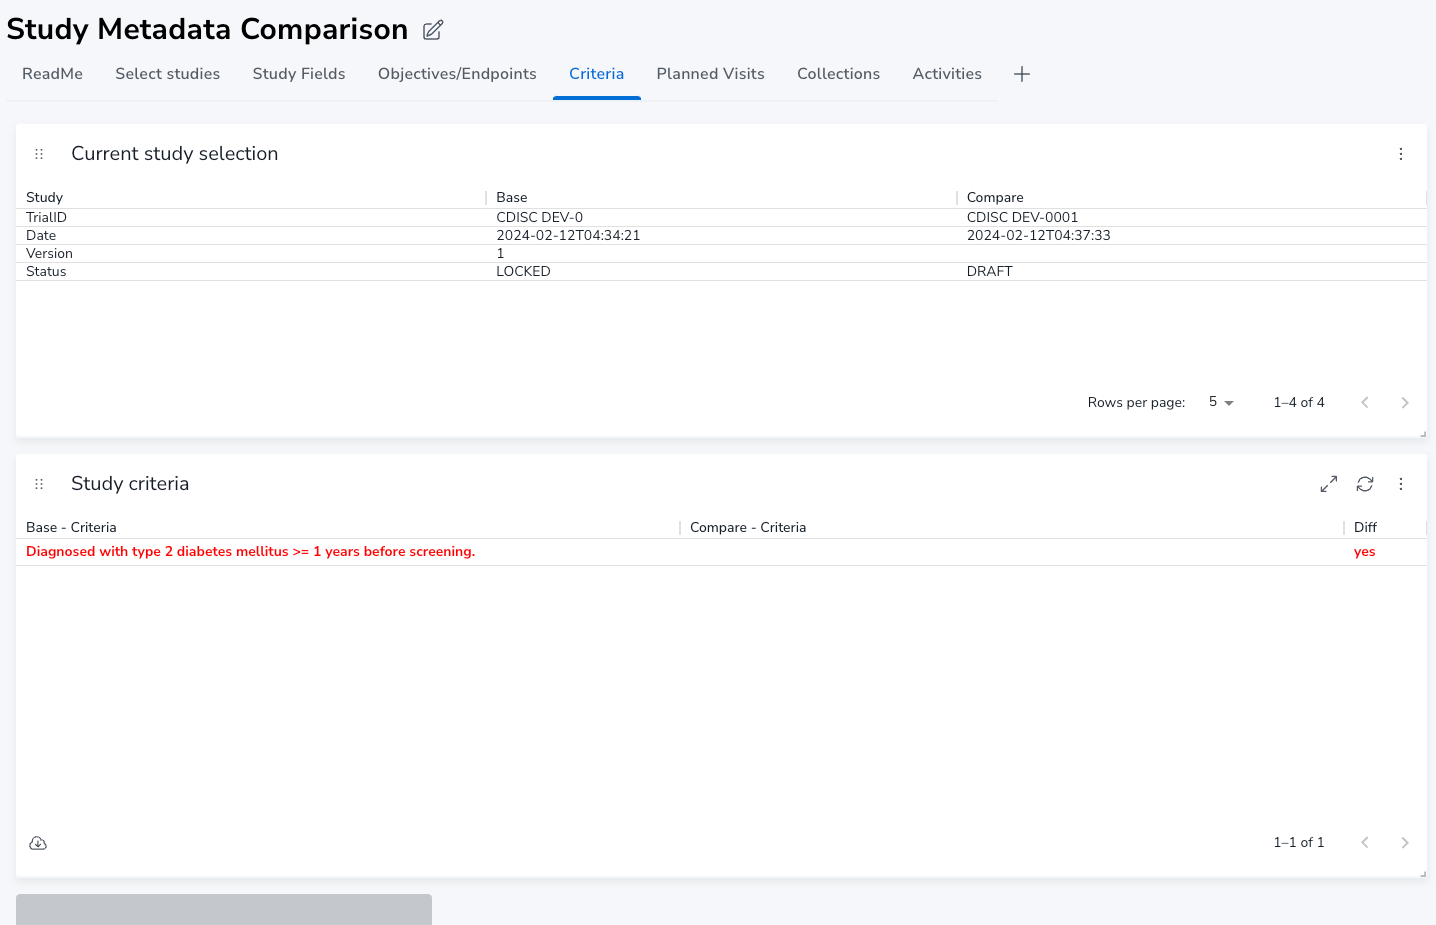
To show similarities, you need to select 'Differences Only' as 'No' on the Select studies tab.
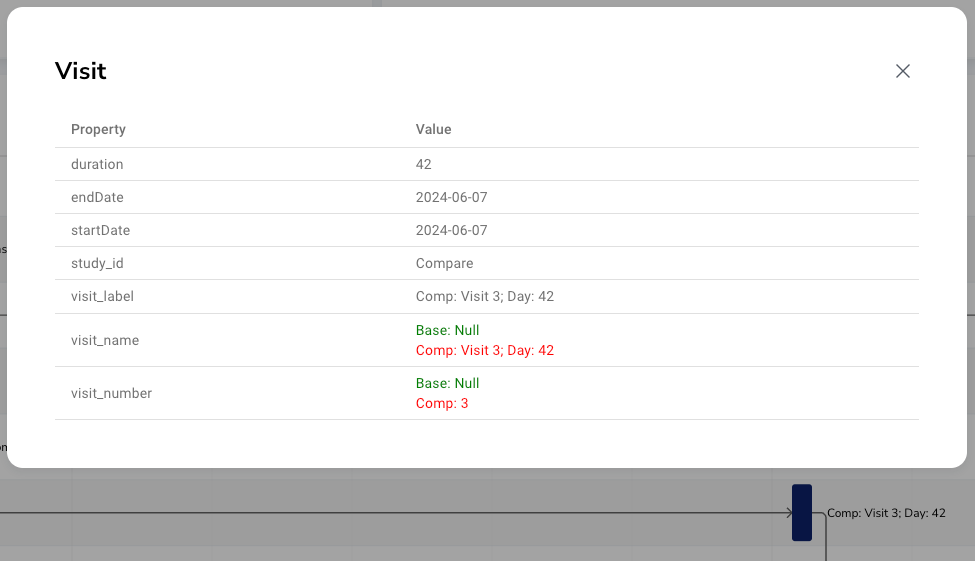
# Planned visits
On the planned visits you can see differences in visits.
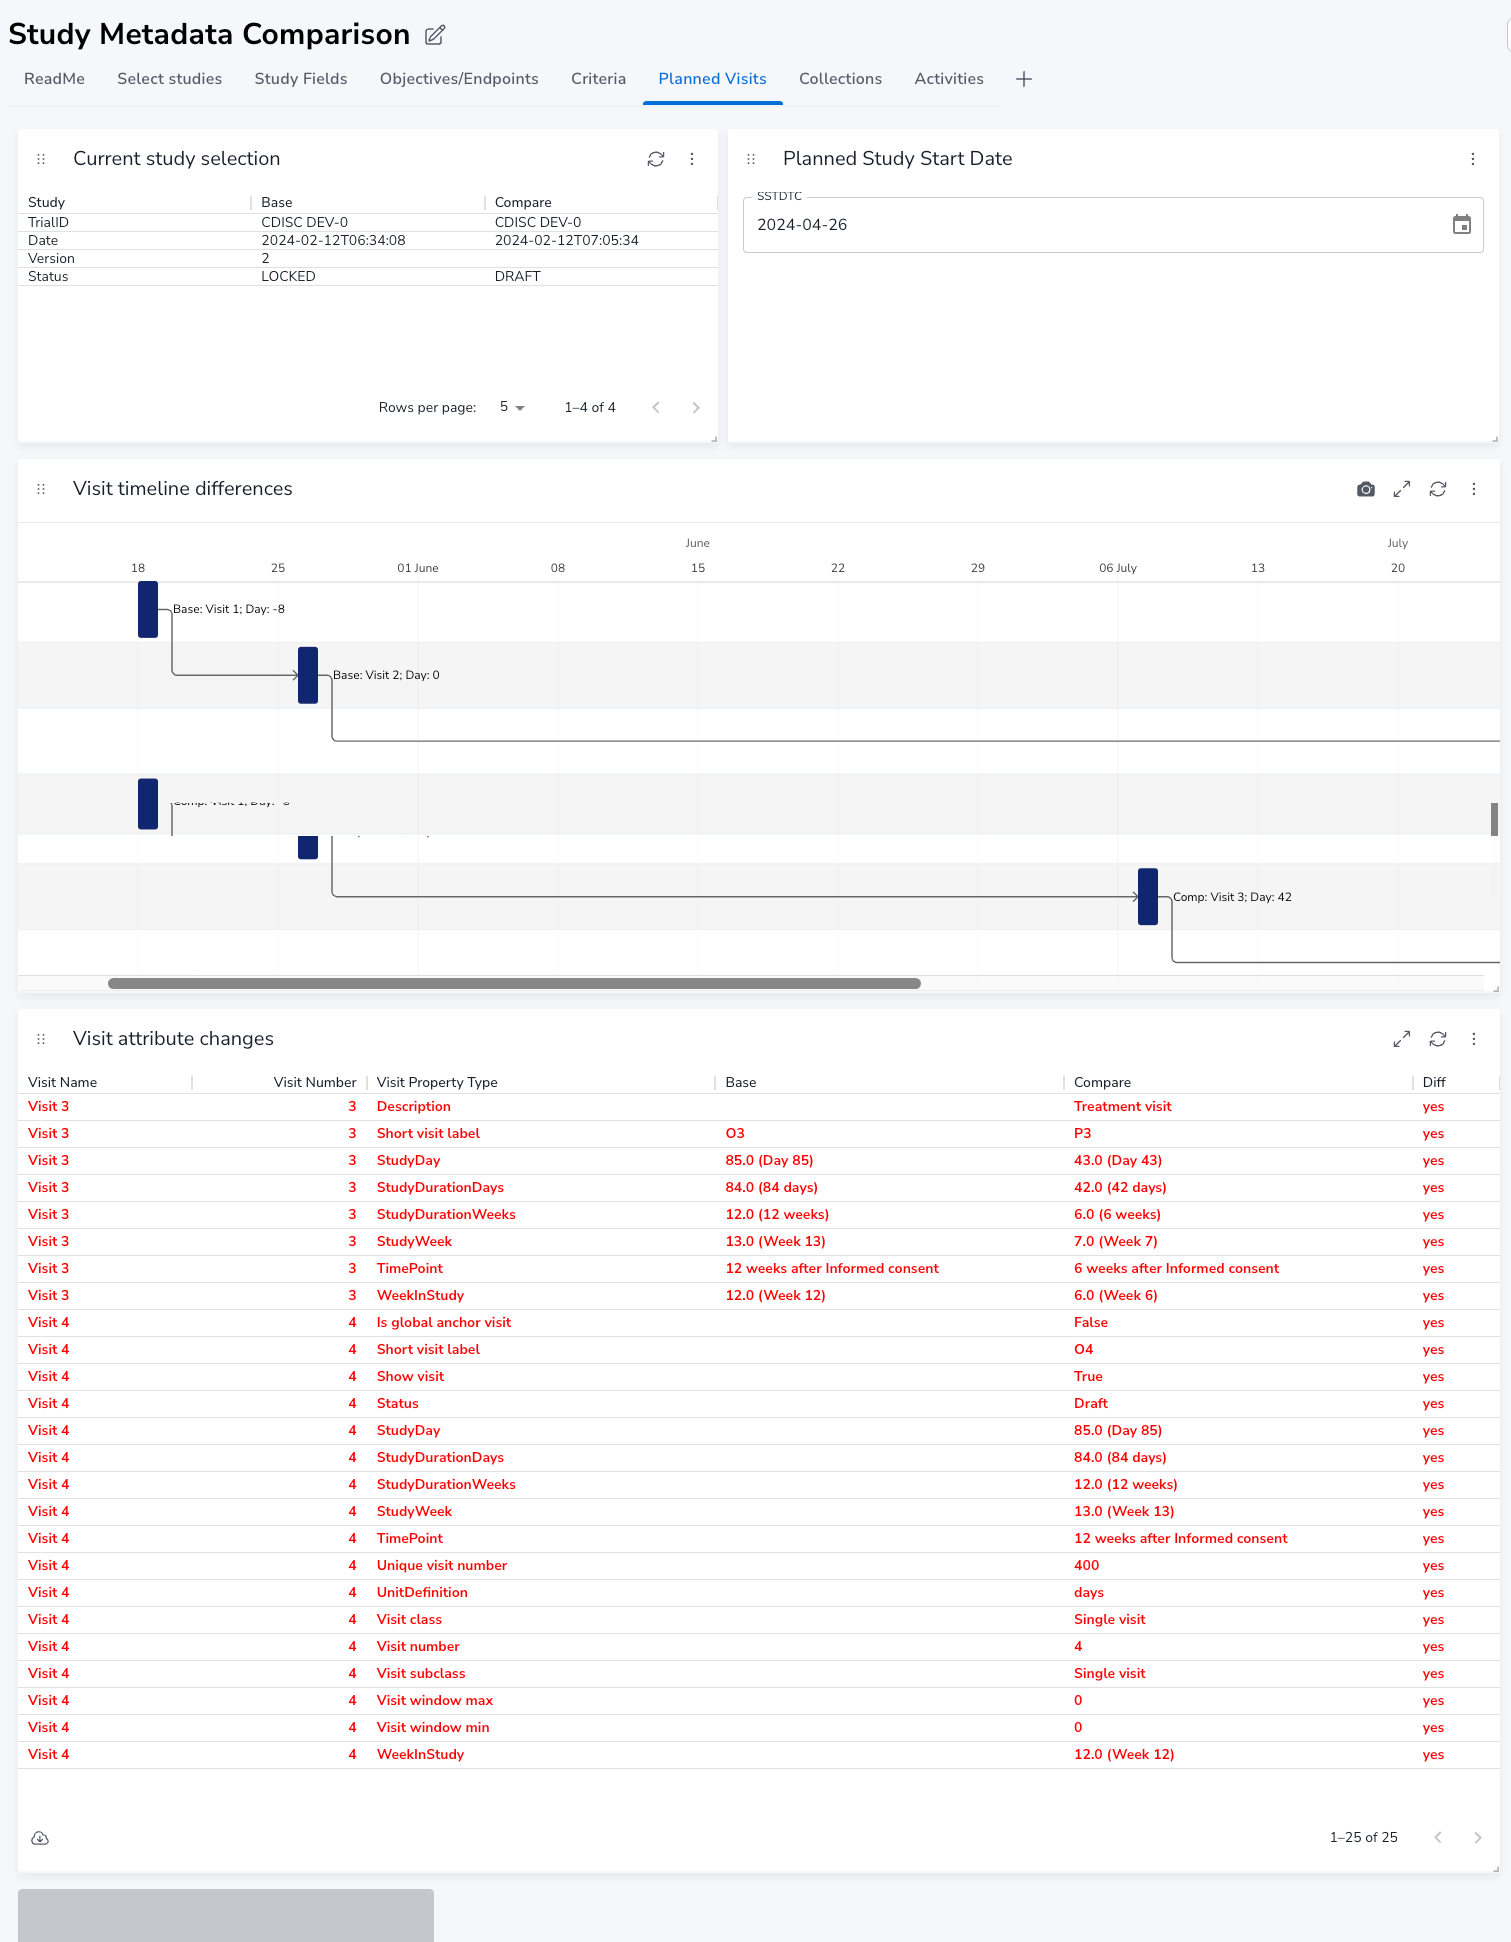
To allow for the timeline view to display, you need to select a date in the Planned Study Start Date.
The timeline will display both differences and similarities. Click on the purple bar to see visit details
To filter on a particular Visit Property Type, you can use the filter
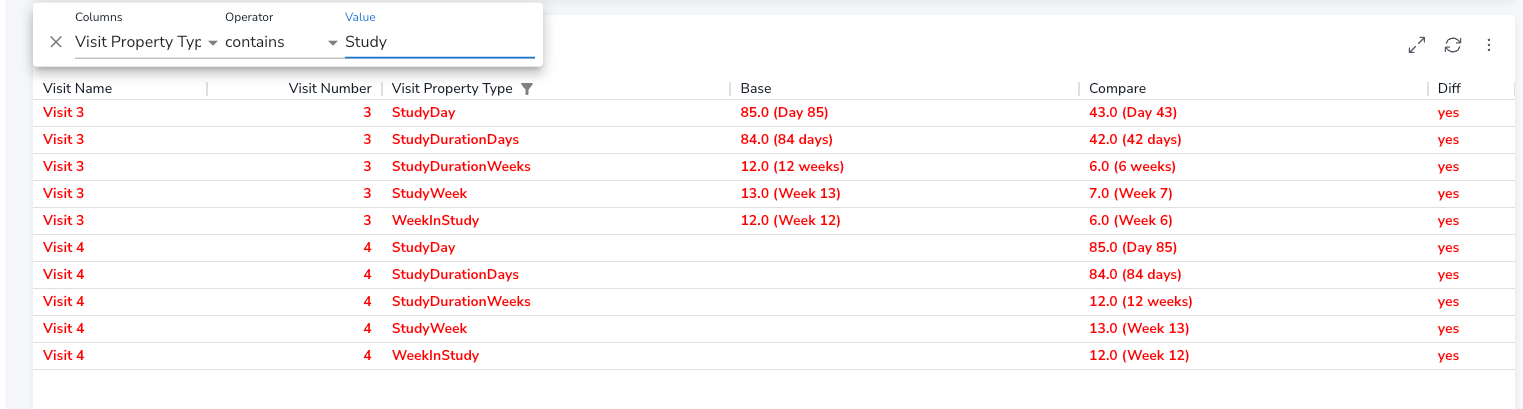
To show similarities, you need to select 'Differences Only' as 'No' on the Select studies tab.
# Collections
On the Collections tab you can see the differences in planned collections, i.e. the 'X's in the flowchart
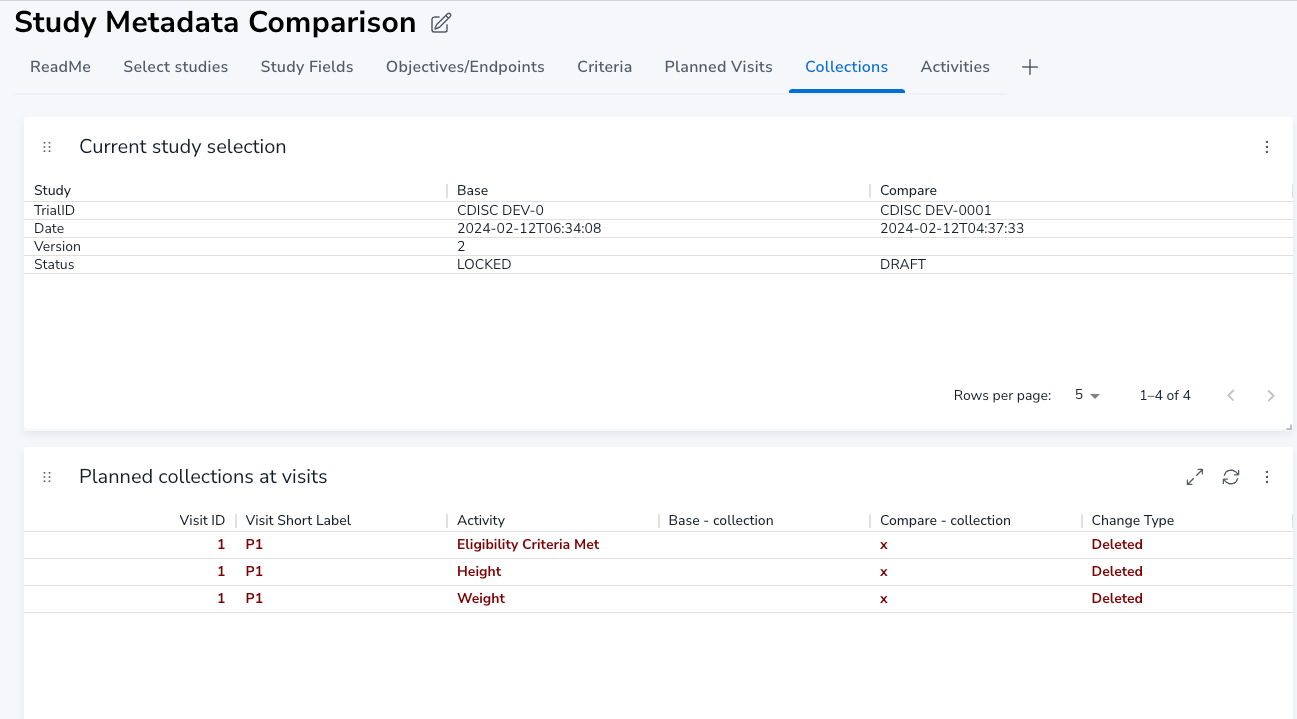
Note This report isn't controlled by the 'Differences Only' selection on the Select studies tab. It will show Added, Deleted and No change
# Activities
On the Activities tab you can see the differences in planned activities and if they have been moved in flowchart hierarchy.
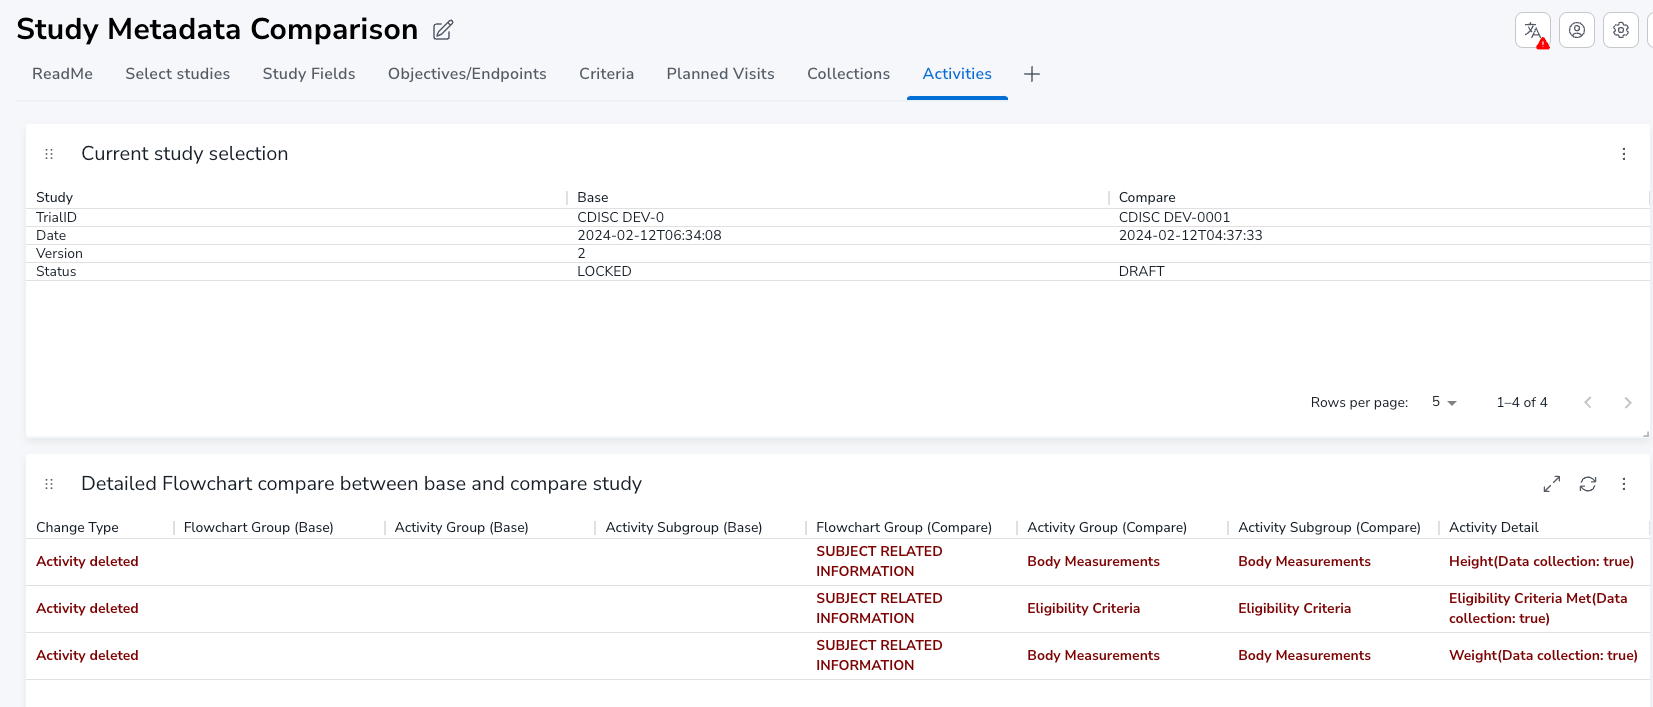
Note This report isn't controlled by the 'Differences Only' selection on the Select studies tab. Is will show Activity added, Activity deleted, Activity moved and No change
# Syntax Template Dashboard
The Syntax Template Dashboard report can be used to browse all syntax templates by template parameters, parameter values, library, filtering by type and sub type as well as see study usage. Beside the ReadMe tab the report holds the following tabs:
- Select Template Parameter Value tab enable browsing and selection of template parameters and their values.
- Parent Templates tab list all Parent Templates. Note this include user defined templates (can be filtered by library), and list is filtered based on Template Parameter selection on first tab.
- Pre-instance Templates tab list all Pre-instantiations of Parent Templates. These are to support study search and selections but will never be related to a study.
- All Templates tab is a union display of both parent templates and pre-instance templates.
- Template Instantiations tab list all instantiations in latest version.
- Study Usage tab list instantiations with reference to study usage.
- Templates by Library gives a summary overview on number of templates by type and library (being sponsor standards or user defined).
# Select Template Parameter Value
On this tab you can list and search in all available template parameters as well as all available template parameter values. The search can be by one of the columns in each table, or by selecting specific Template Parameters or Template Parameter Values from the two top report panels.
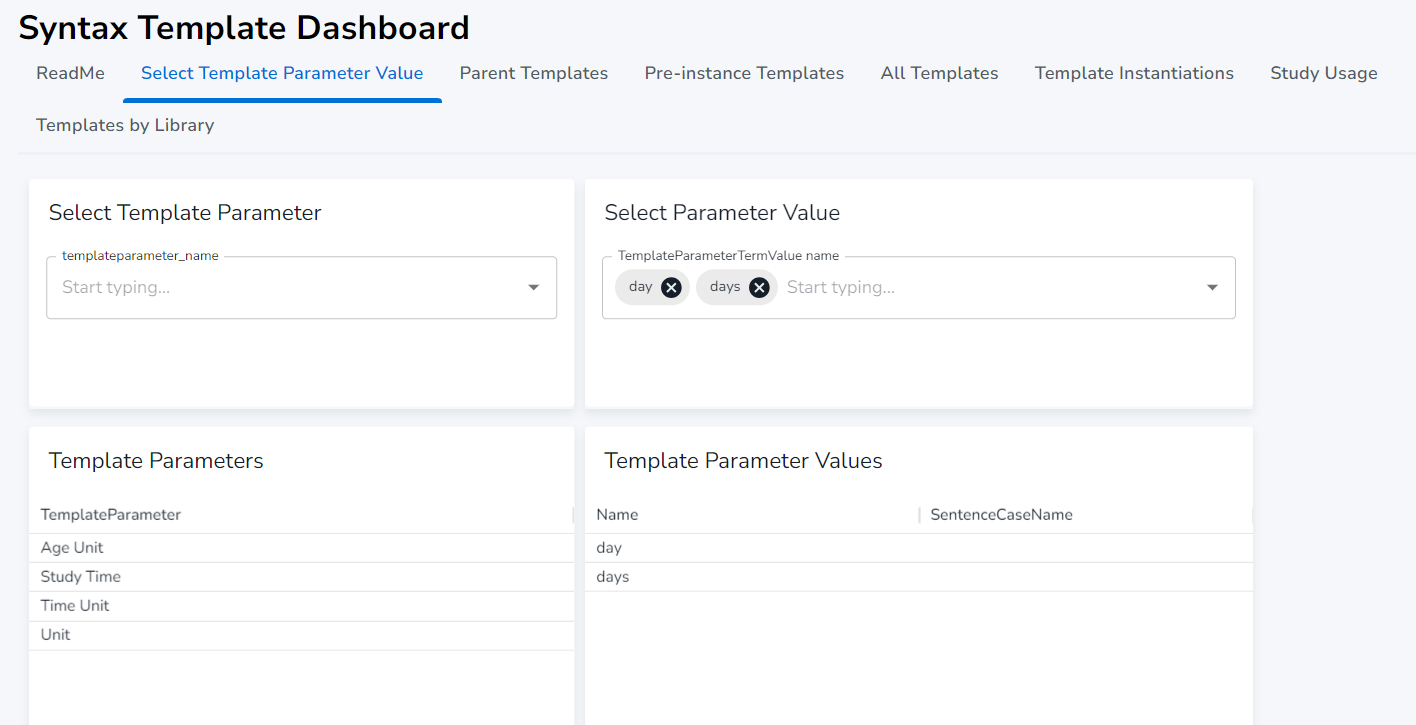
In this example the 'day' and 'days' is selected as template parameter values, the template parameters holding one of these are listed in the left report panel.
Note, the selections of Template Parameters or Template Parameter Values from the two top report panels will be applied on all following tabs.
# Parent Templates
On this tab you can search in all parent syntax templates of any type in any library. The display is filtered to parent syntax templates that refer to currently selected template parameters listed in the top report panel.
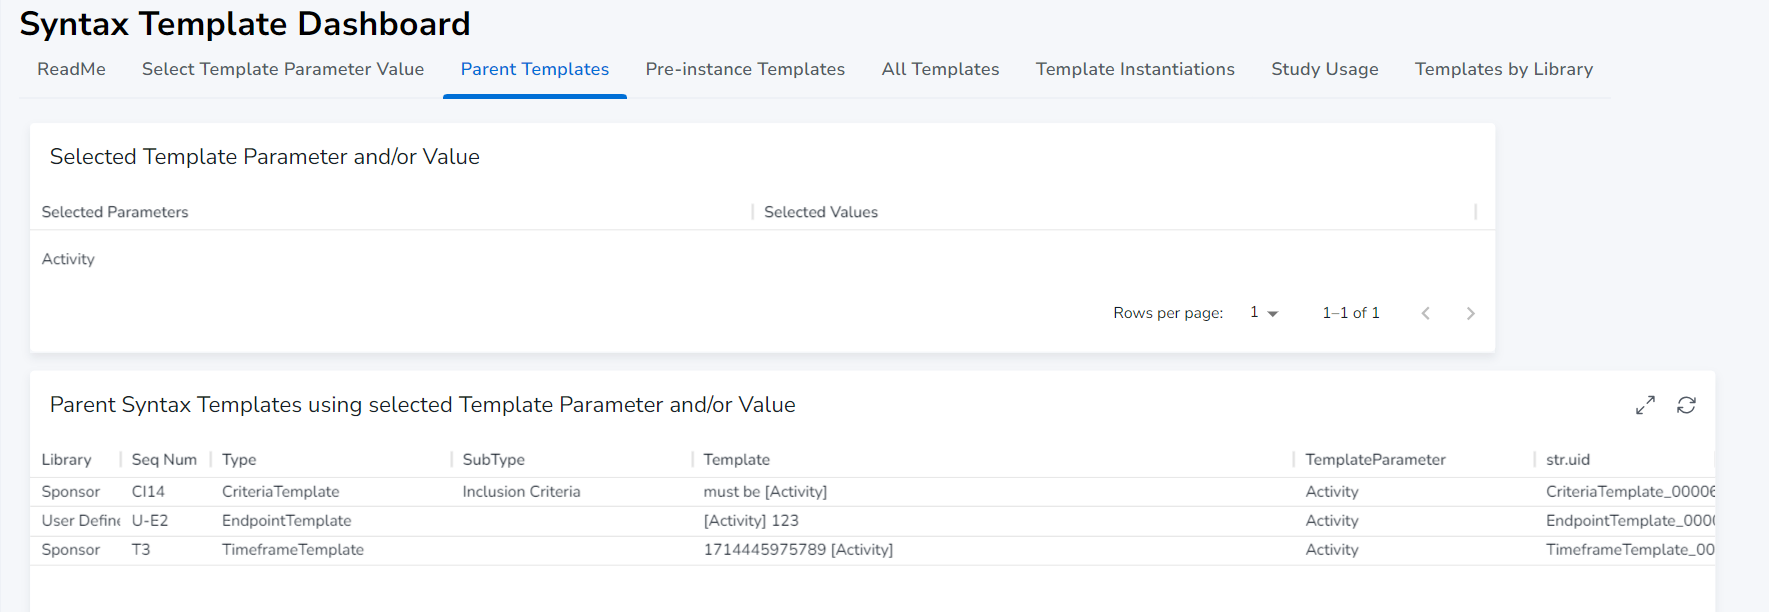
In this example the 'Activity' template parameter value is selected and the listing shows 3 syntax templates referring to the Activity parameter, each of different type and in different libraries.
Note, A user defined syntax template is technically also a parent template and will show up on the list. These can be removed by additional filtering on the library.
# Pre-instance Templates
On this tab you can search in all pre-instance syntax templates of any type in any library. The display is filtered to pre-instance syntax templates that refer to currently selected template parameters and values listed in the top report panel.
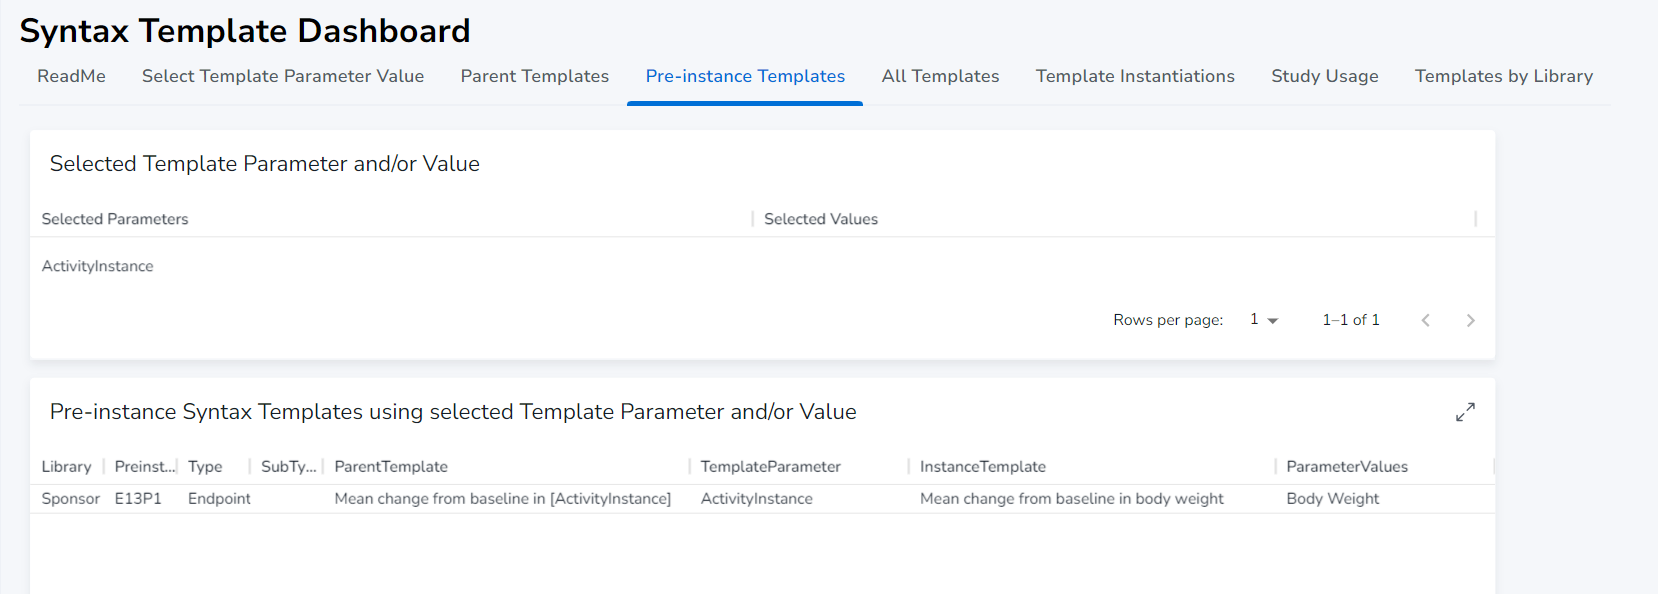
In this example the 'ActivityInstance' template parameter value is selected and the listing shows 1 syntax templates referring to the ActivityInstance parameter.
Note, A pre-instance syntax template is made only to support selection of syntax templates with pre-selected values for template parameters.
# All Templates
On this tab you can do a joined search in all parent and pre-instance syntax templates of any type in any library. The display is filtered to syntax templates that refer to currently selected template parameters and values listed in the top report panel.
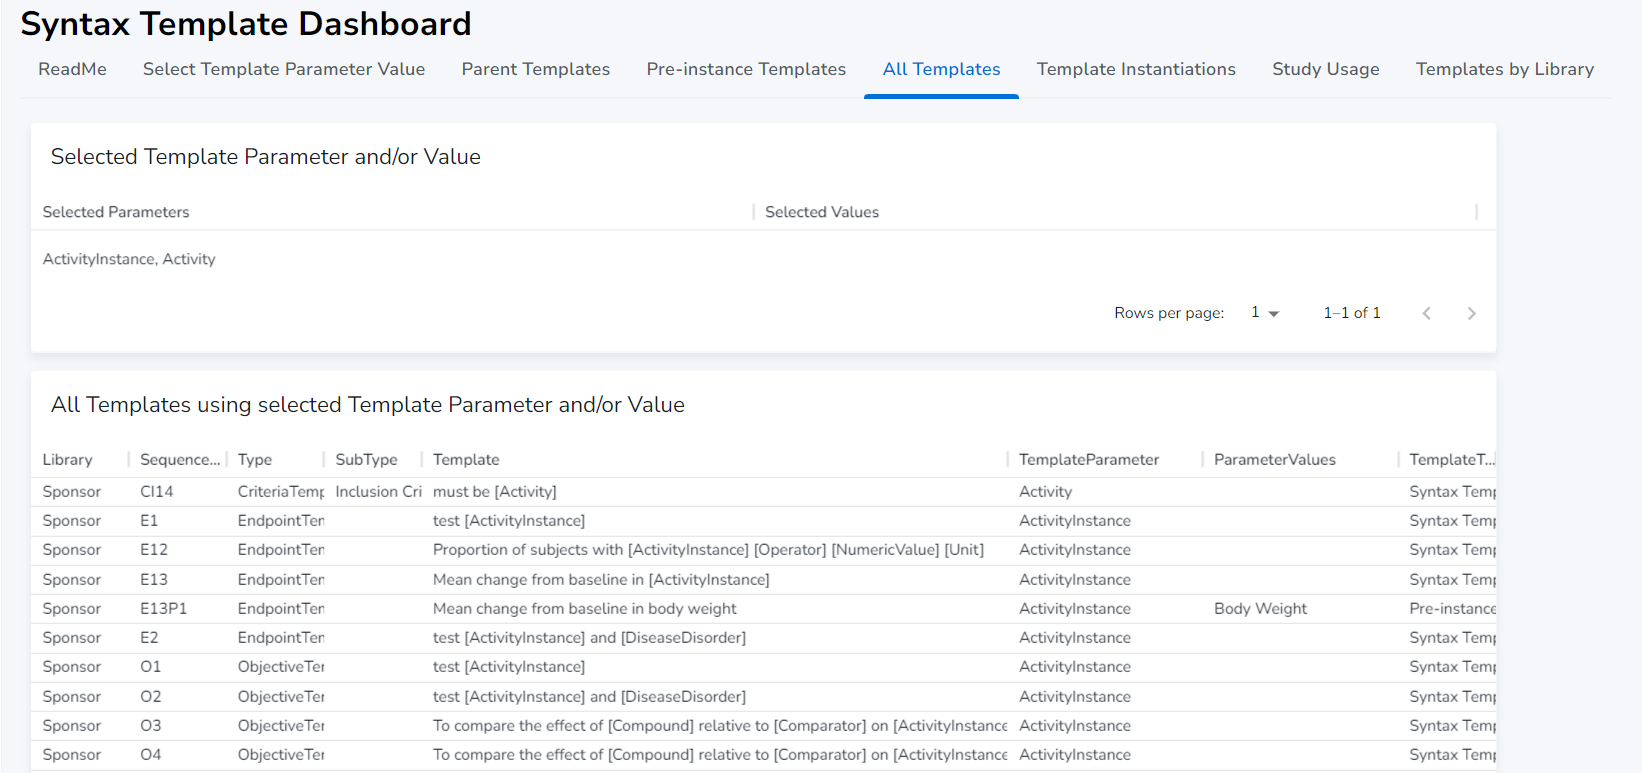
In this example both the 'Activity' and 'ActivityInstance' template parameter value is selected and the listing shows a number of syntax templates referring to these two parameters.
# Template Instantiations
On this tab you can search instantiations of syntax templates of any type in any library, i.e. a syntax template actually being used on a study. The display is filtered to syntax templates that refer to currently selected template parameters and values listed in the top report panel.
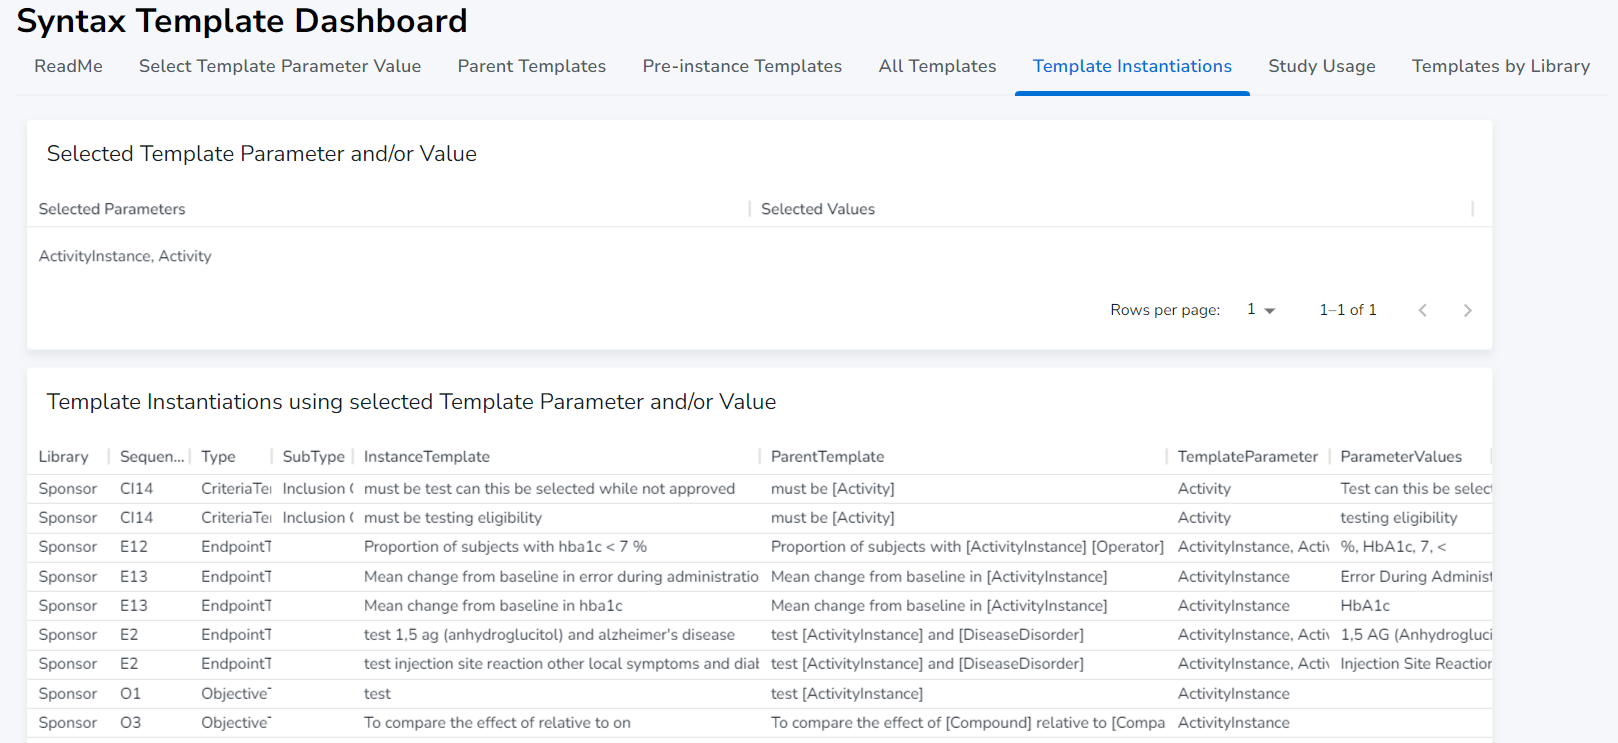
In this example both the 'Activity' and 'ActivityInstance' template parameter value is selected and the listing shows a number of syntax template instantiations referring to these two parameters.
Note, the list of template instantiations includes instantiations of user defined templates including their template parameter values. These can be removed by additional filtering on the library. Note, next tab list details on the studies using these template instantiations.
# Study Usage
On this tab you can search study usage of syntax templates of any type in any library. The display is filtered to syntax templates that refer to currently selected template parameters and values listed in the top report panel.
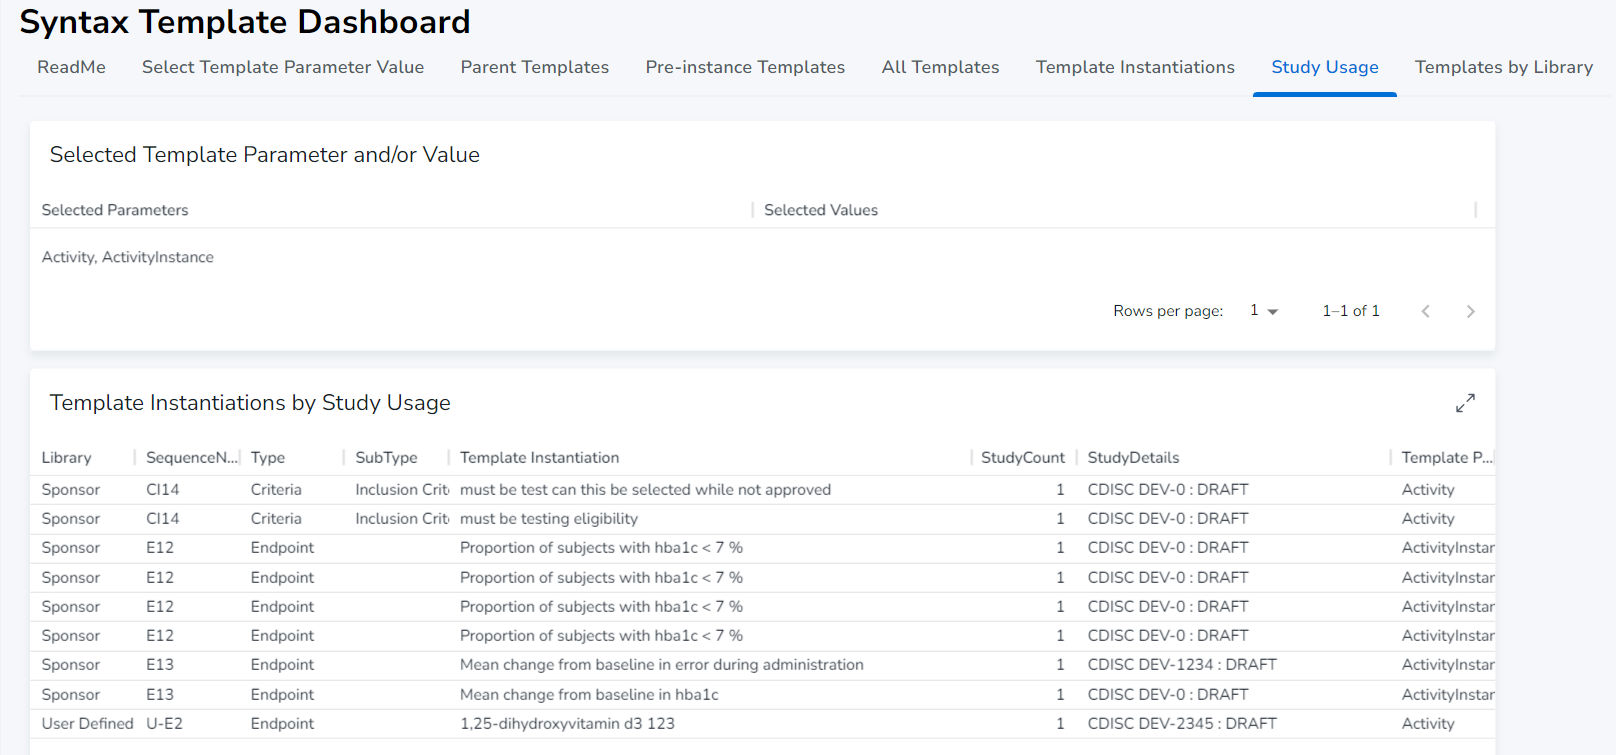
In this example both the 'Activity' and 'ActivityInstance' template parameter value is selected and the listing shows the studies using syntax templates referring to these two parameters.
Note, the list of template instantiations includes instantiations of user defined templates including their template parameter values. These can be removed by additional filtering on the library. Note, previous tab list more details for these template instantiations.
# Templates by Library
On this tab you get an overview of all syntax templates in the system, grouped by type and library. You can change the layout of the bar chart by field selections below the chart.
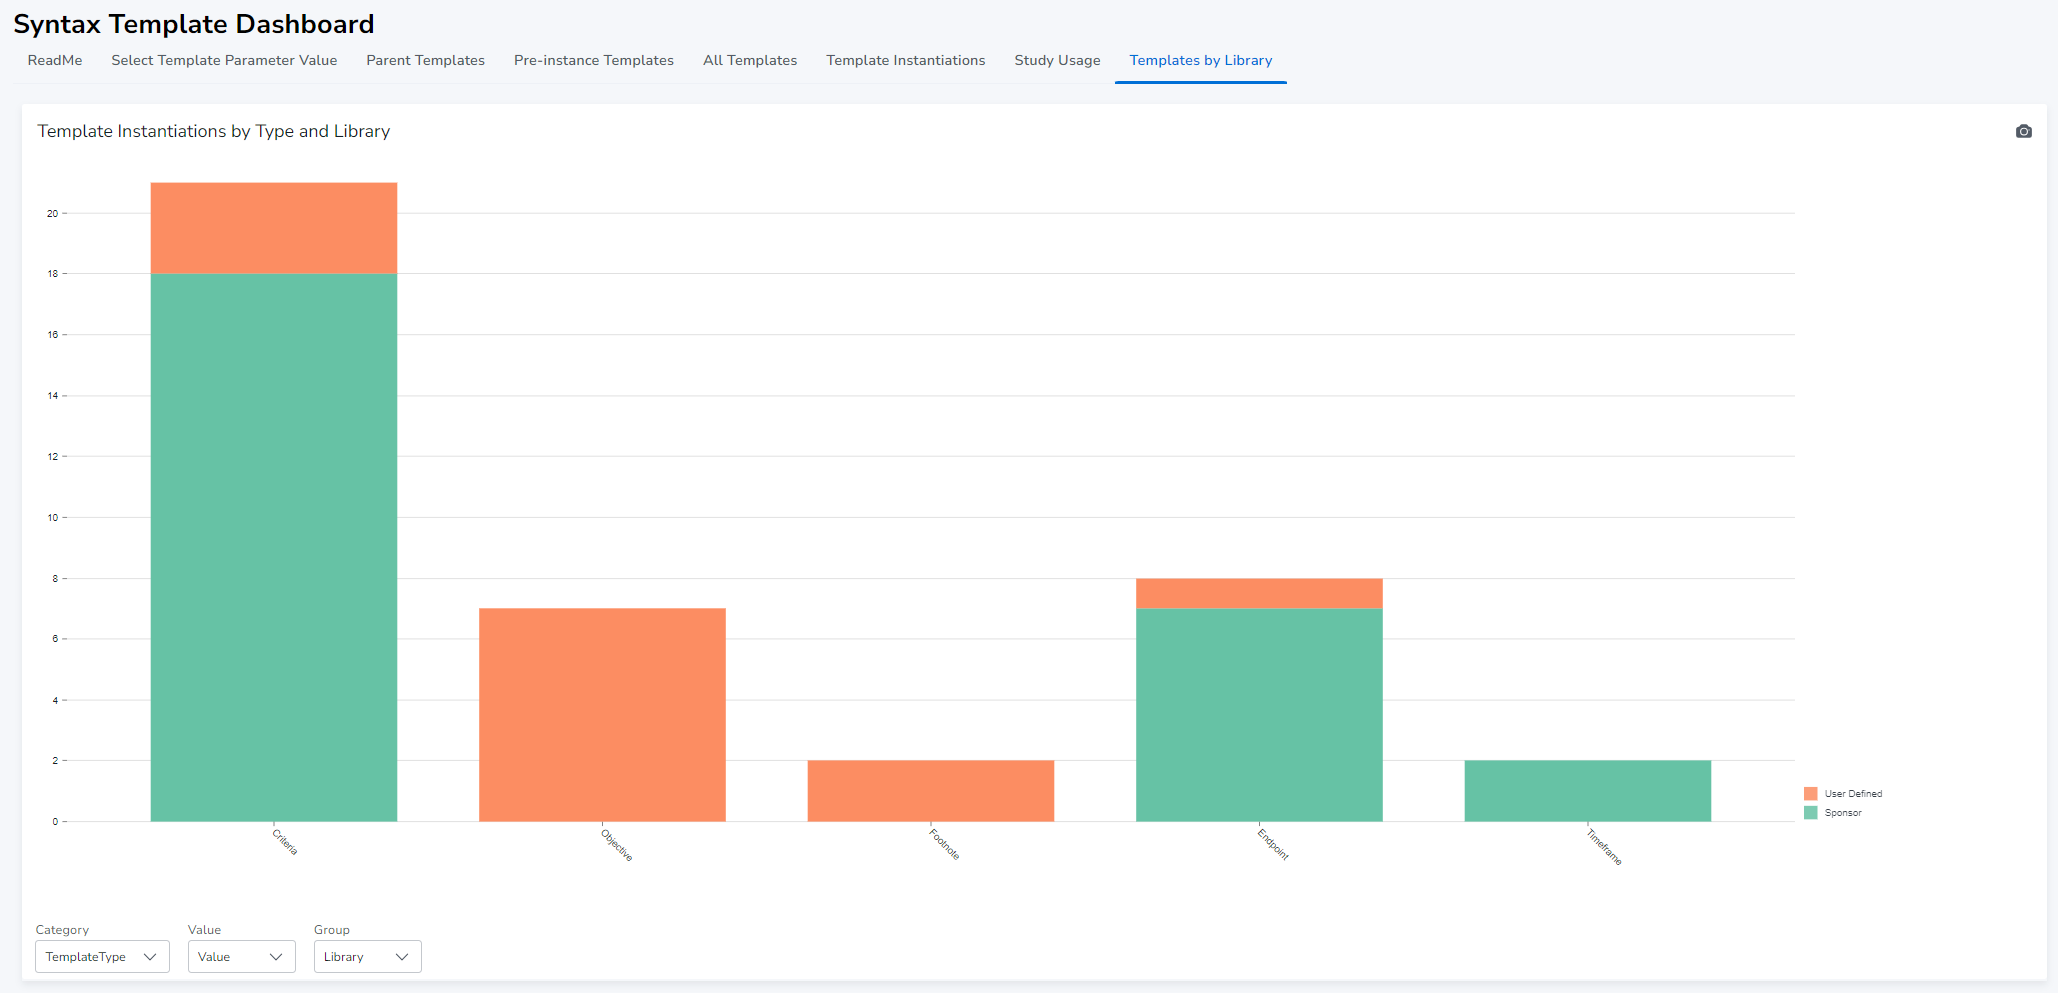
In this example each bar represent a template type with colour coding by library
# Activity Metadata Check
The activity metadata check report is a dashboard aimed for the user who maintains the definition of activities and activity instances in the Study Builder Library. The two main things this dashboard focus on are:
- to check if an activity instances have the required items
- to check if the activities and activity instances are assigned to valid groupings

Some of the tabs goes in pairs and indicated by by the yellow underline in the Tabs in report
# ReadMe
Provides a short summary of the reports's scope and functionality.
# Search bottom-up
This tab has been included for general display for groupings of activities and activity instances.
Please see Activity Lib (search bottom-up) for how that panel works.
# List of Missing Activity Items for Activity Instances
The tabs Activity Lib (search top-down) and the List of Missing Mandatory Items for Instances goes hand in hand.
# Search top-down
To limit the number of activities shown in the List of Missing Mandatory Items for Instances the user can make a top-down search. Please see Activity Lib (search top-down) for how that panel works.
# Display missing items
On the List of Missing Mandatory Items for Instances tab a list of Activities that has missing mandatory items are displayed.
Having made the following filter on the Activity Lib (search top-down) tab
will display the filtered list of activity instances having missing mandatory items:
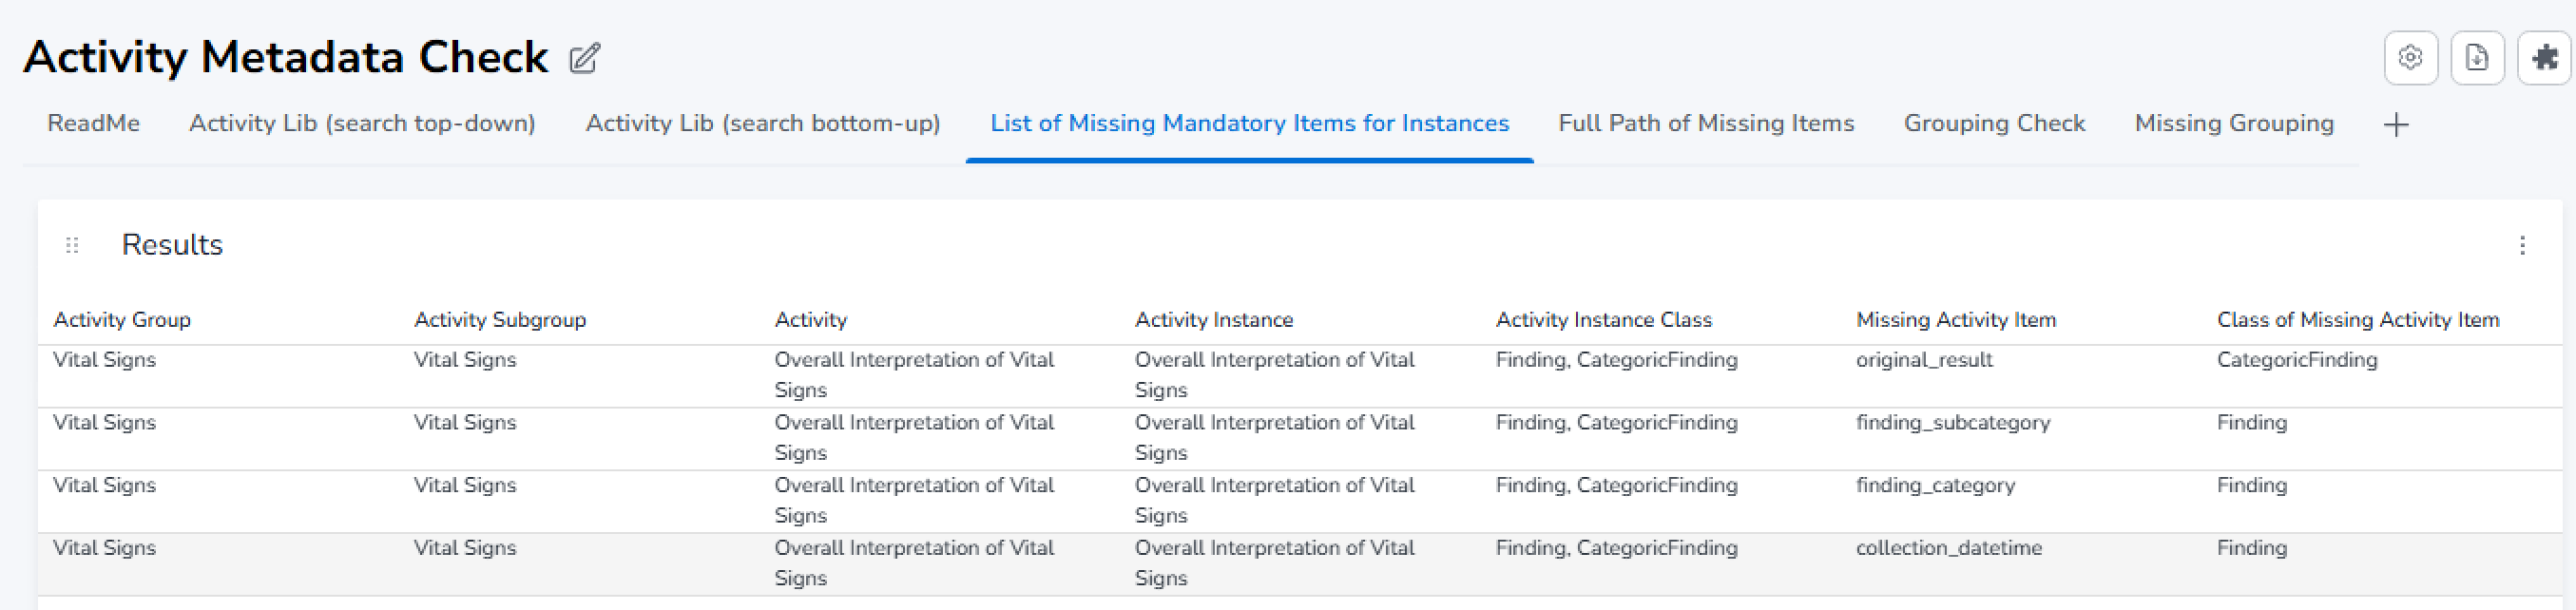
Note: The data displayed depends on the database content.
# Full Path of Missing Items
The instances and their items follow a Activity Instance Class model, see Class Model
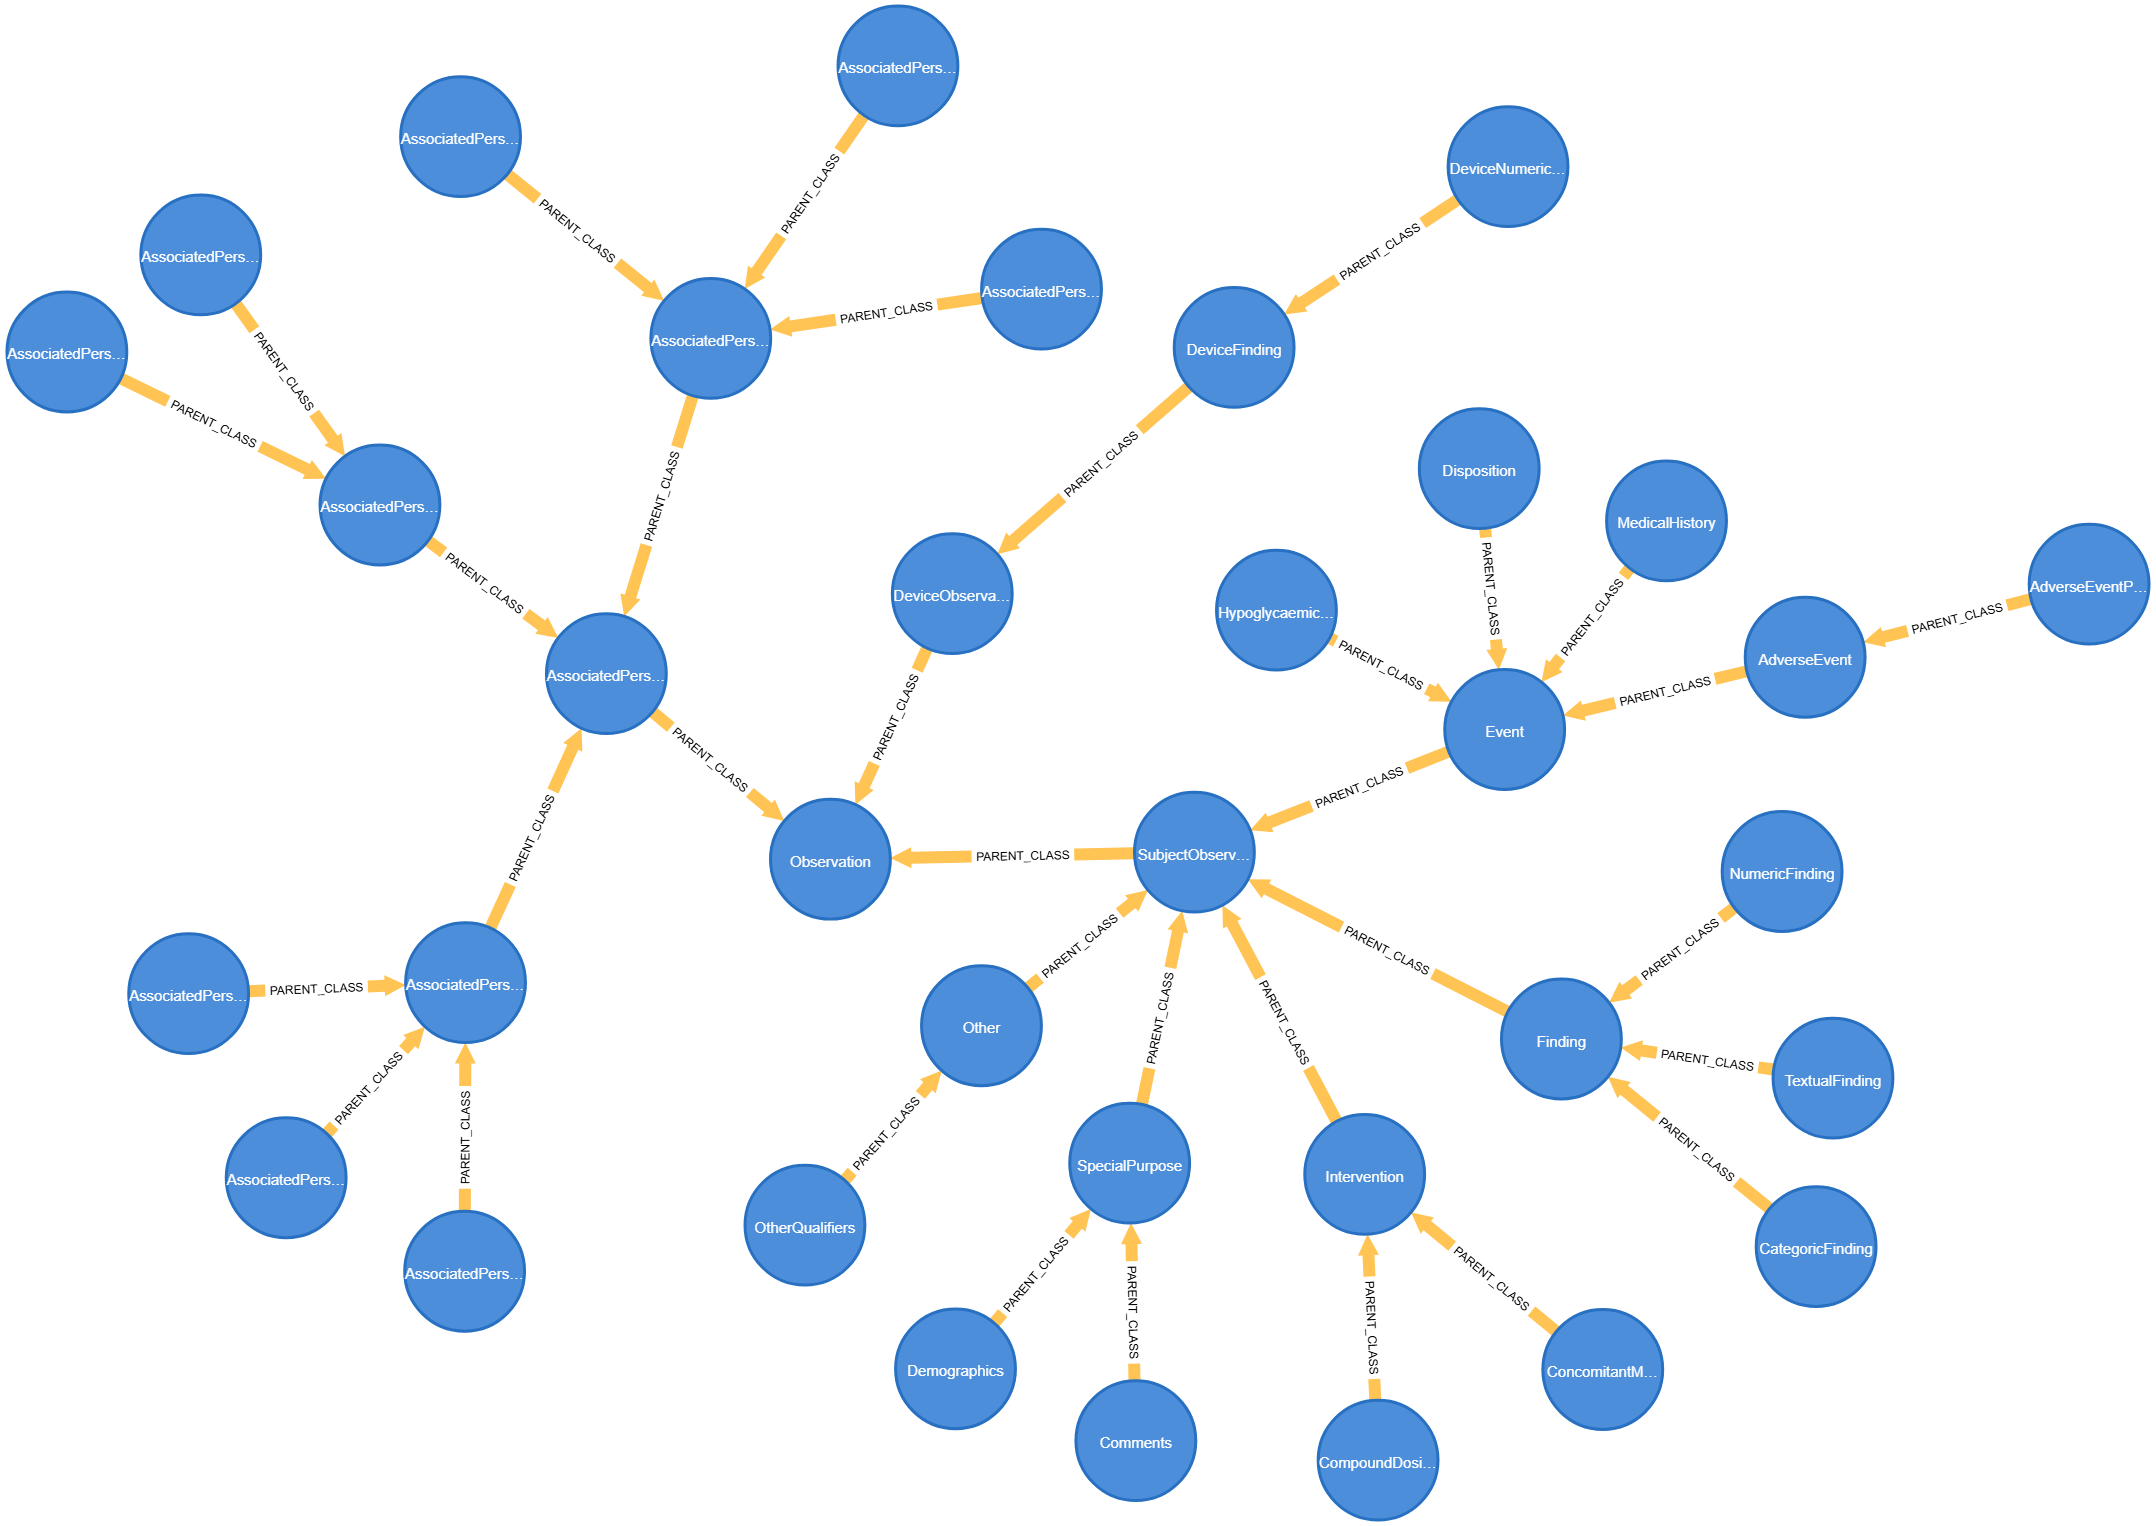
In this this tab, activity instances with missing items belonging to other classes than the immediate parent are added in listing of missing item. For the filter example above:
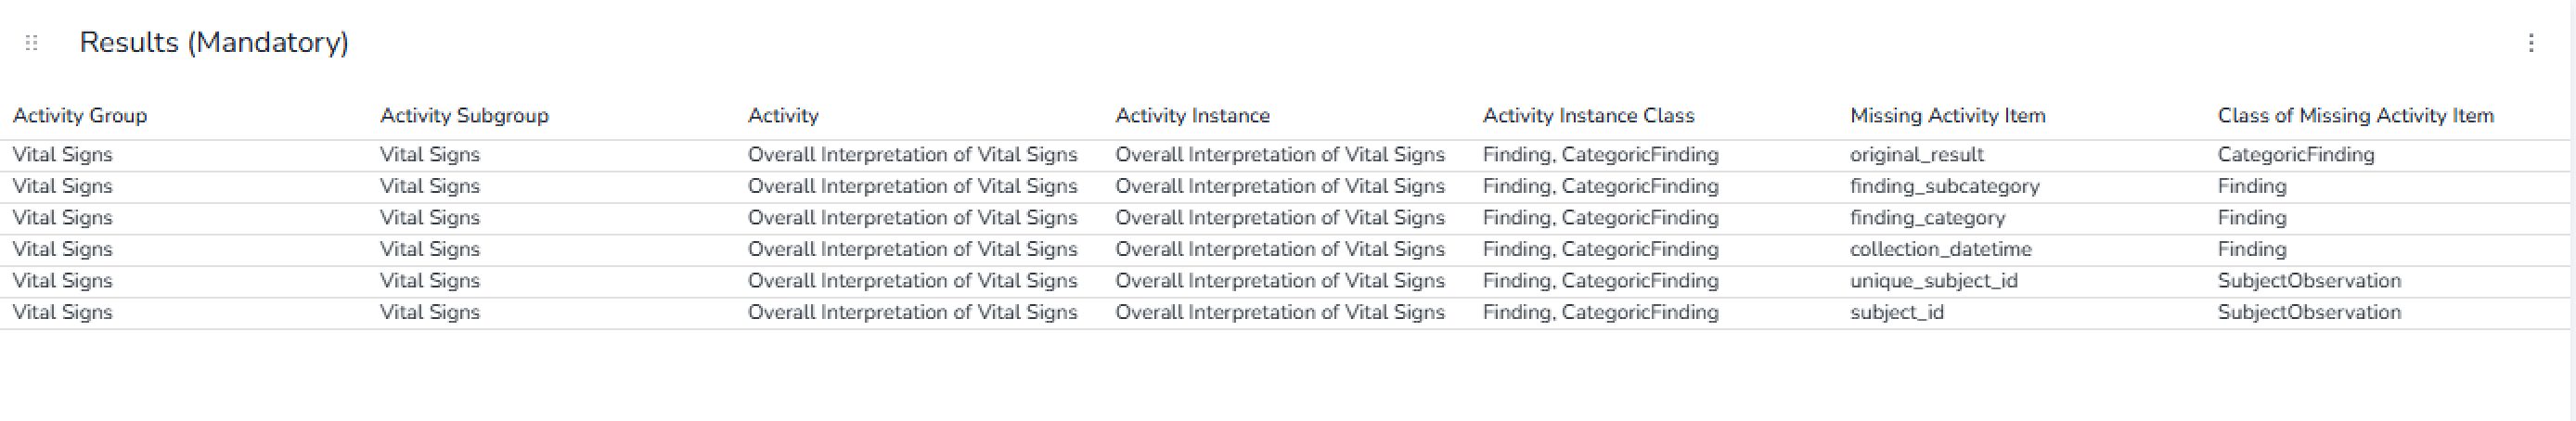
Note that this tab has filter buttons. These are prefilled with values from the Activity Lib (search top-down) tab, but can be changed on this page as well.
# Grouping Check
This tab provides status of activities groupings. The top part displays any activities that do not have a grouping assigned.
The bottom part provides a list of the activities /activity instances and count of their grouping
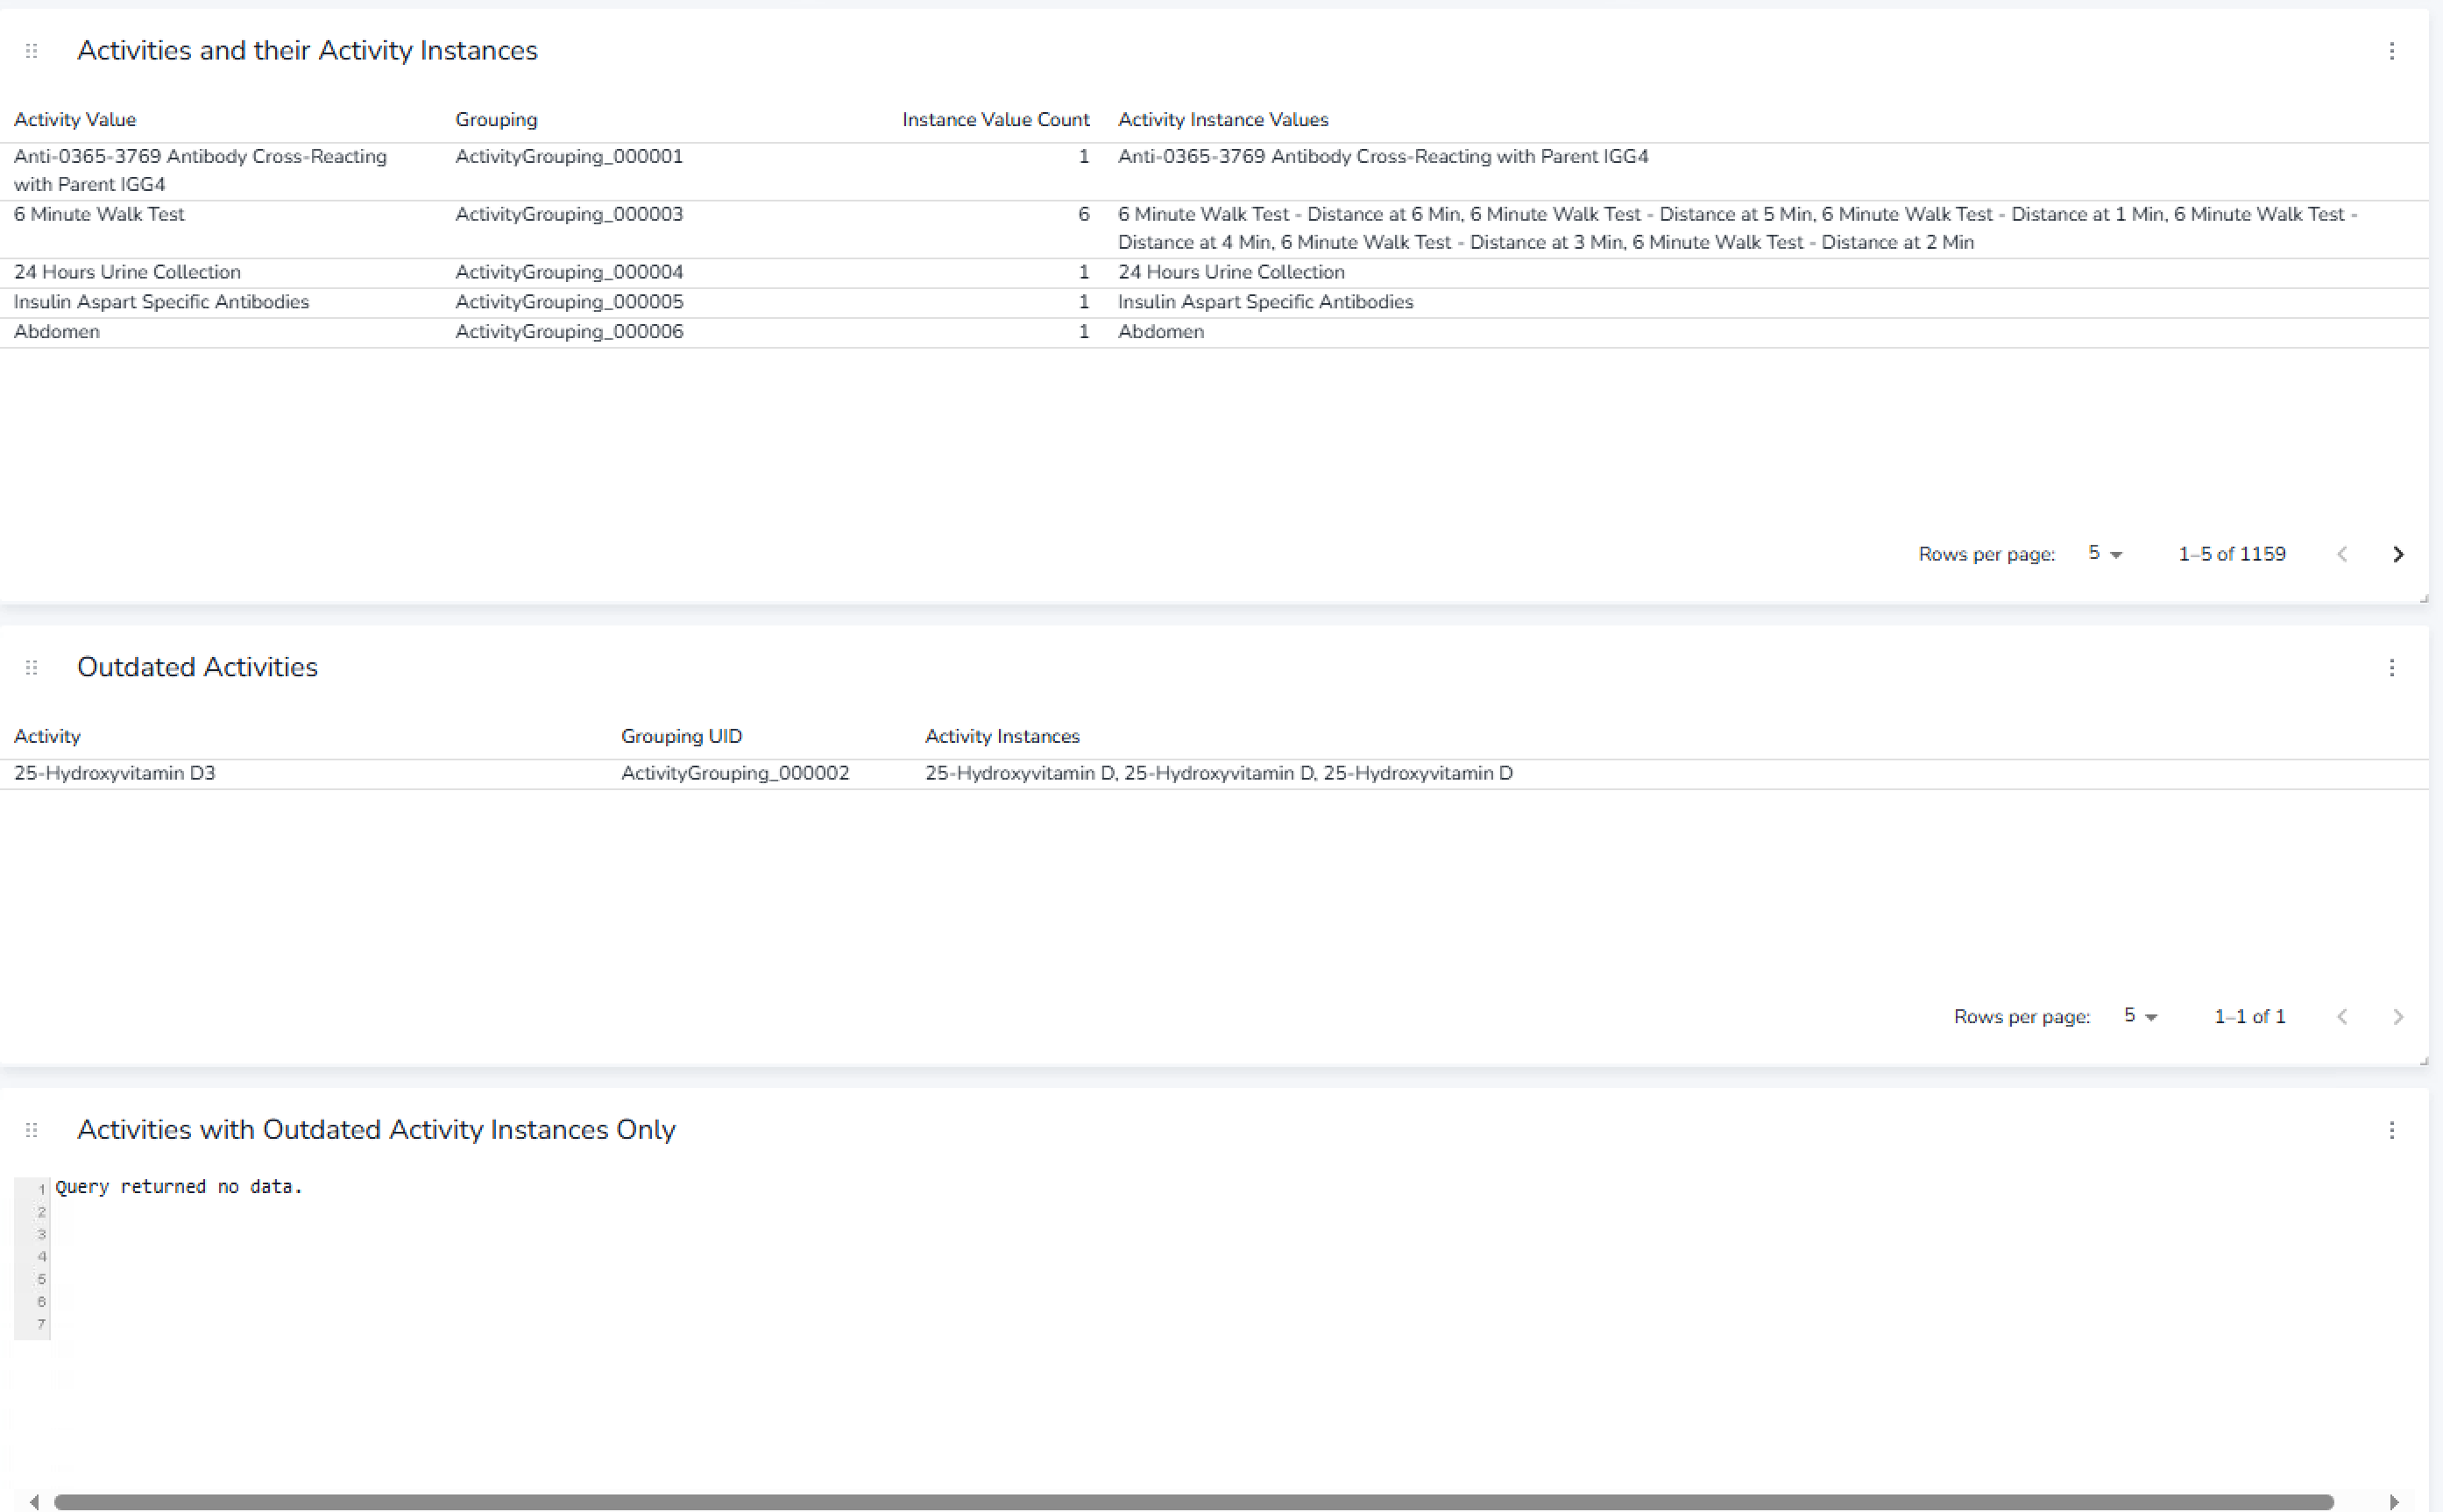
It also displays if there are activities with an activity instance related to it that are not used any more, i.e. activity has no latest version, but has an activity instance with latest version related to it.
The display for outdated activity instances is listing any latest activity that doesn't have an activity instance related to it that is latest version.
# Display missing groupings
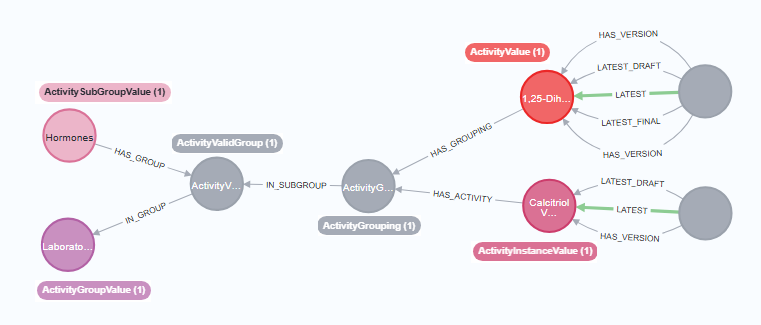
The activities and their instances are related via a grouping:
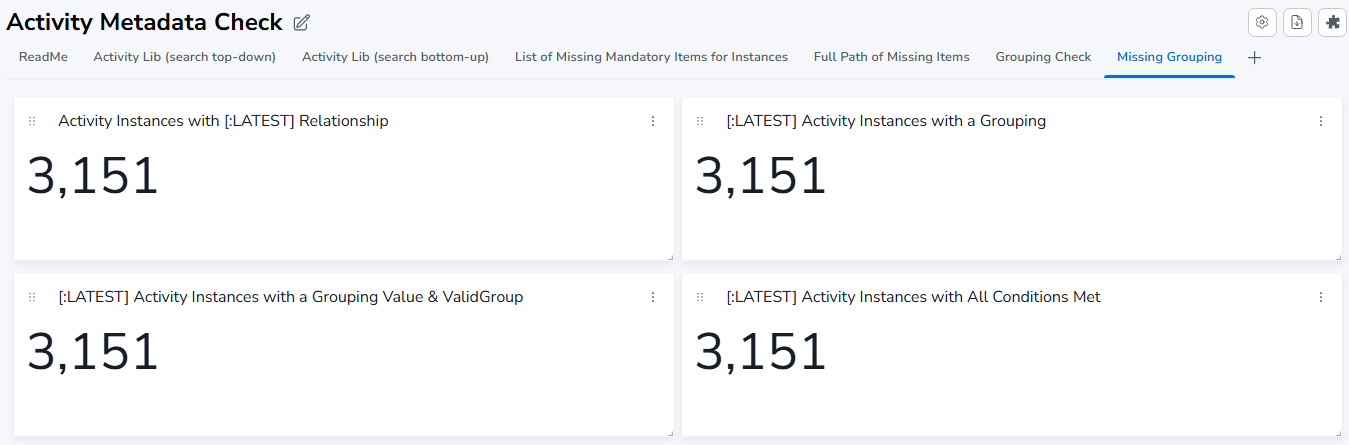
This tab displays different counts for the activities and activity instances.
- count the number of latests activities
- count the number of activity instances with a grouping
- count the number of activity instances with a grouping and a valid group
- count the activities where all the above is present
# CRF Library Versions
The CRF Library Versions report allows users to compare versions of CRF collections as well as individual CRFs, Groups, and Items. This report provides a detailed drill-down approach to view differences in attributes, structure, and content between different versions of CRF library elements.
Besides the ReadMe tab the report holds the following tabs:
- CRF Collection tab provides a drill-down approach to compare CRF collections, view differences in CRFs, Groups, and Items within the collections.
- Collection Release Notes tab displays a consolidated view of all changes between two collection versions with filtering options.
- CRF Versions tab focuses on comparing individual CRF versions, displaying attribute differences and which collections contain them.
- CRF Release Notes tab provides a consolidated view of all changes between two CRF versions.
- Group Versions tab focuses on comparing individual Group versions, displaying attribute differences and which collections and CRFs contain them.
- Item Versions tab focuses on comparing individual Item versions, displaying attribute differences and which collections, CRFs, and Groups contain them.
# CRF Collection
This tab enables a comprehensive drill-down comparison workflow for CRF collections:
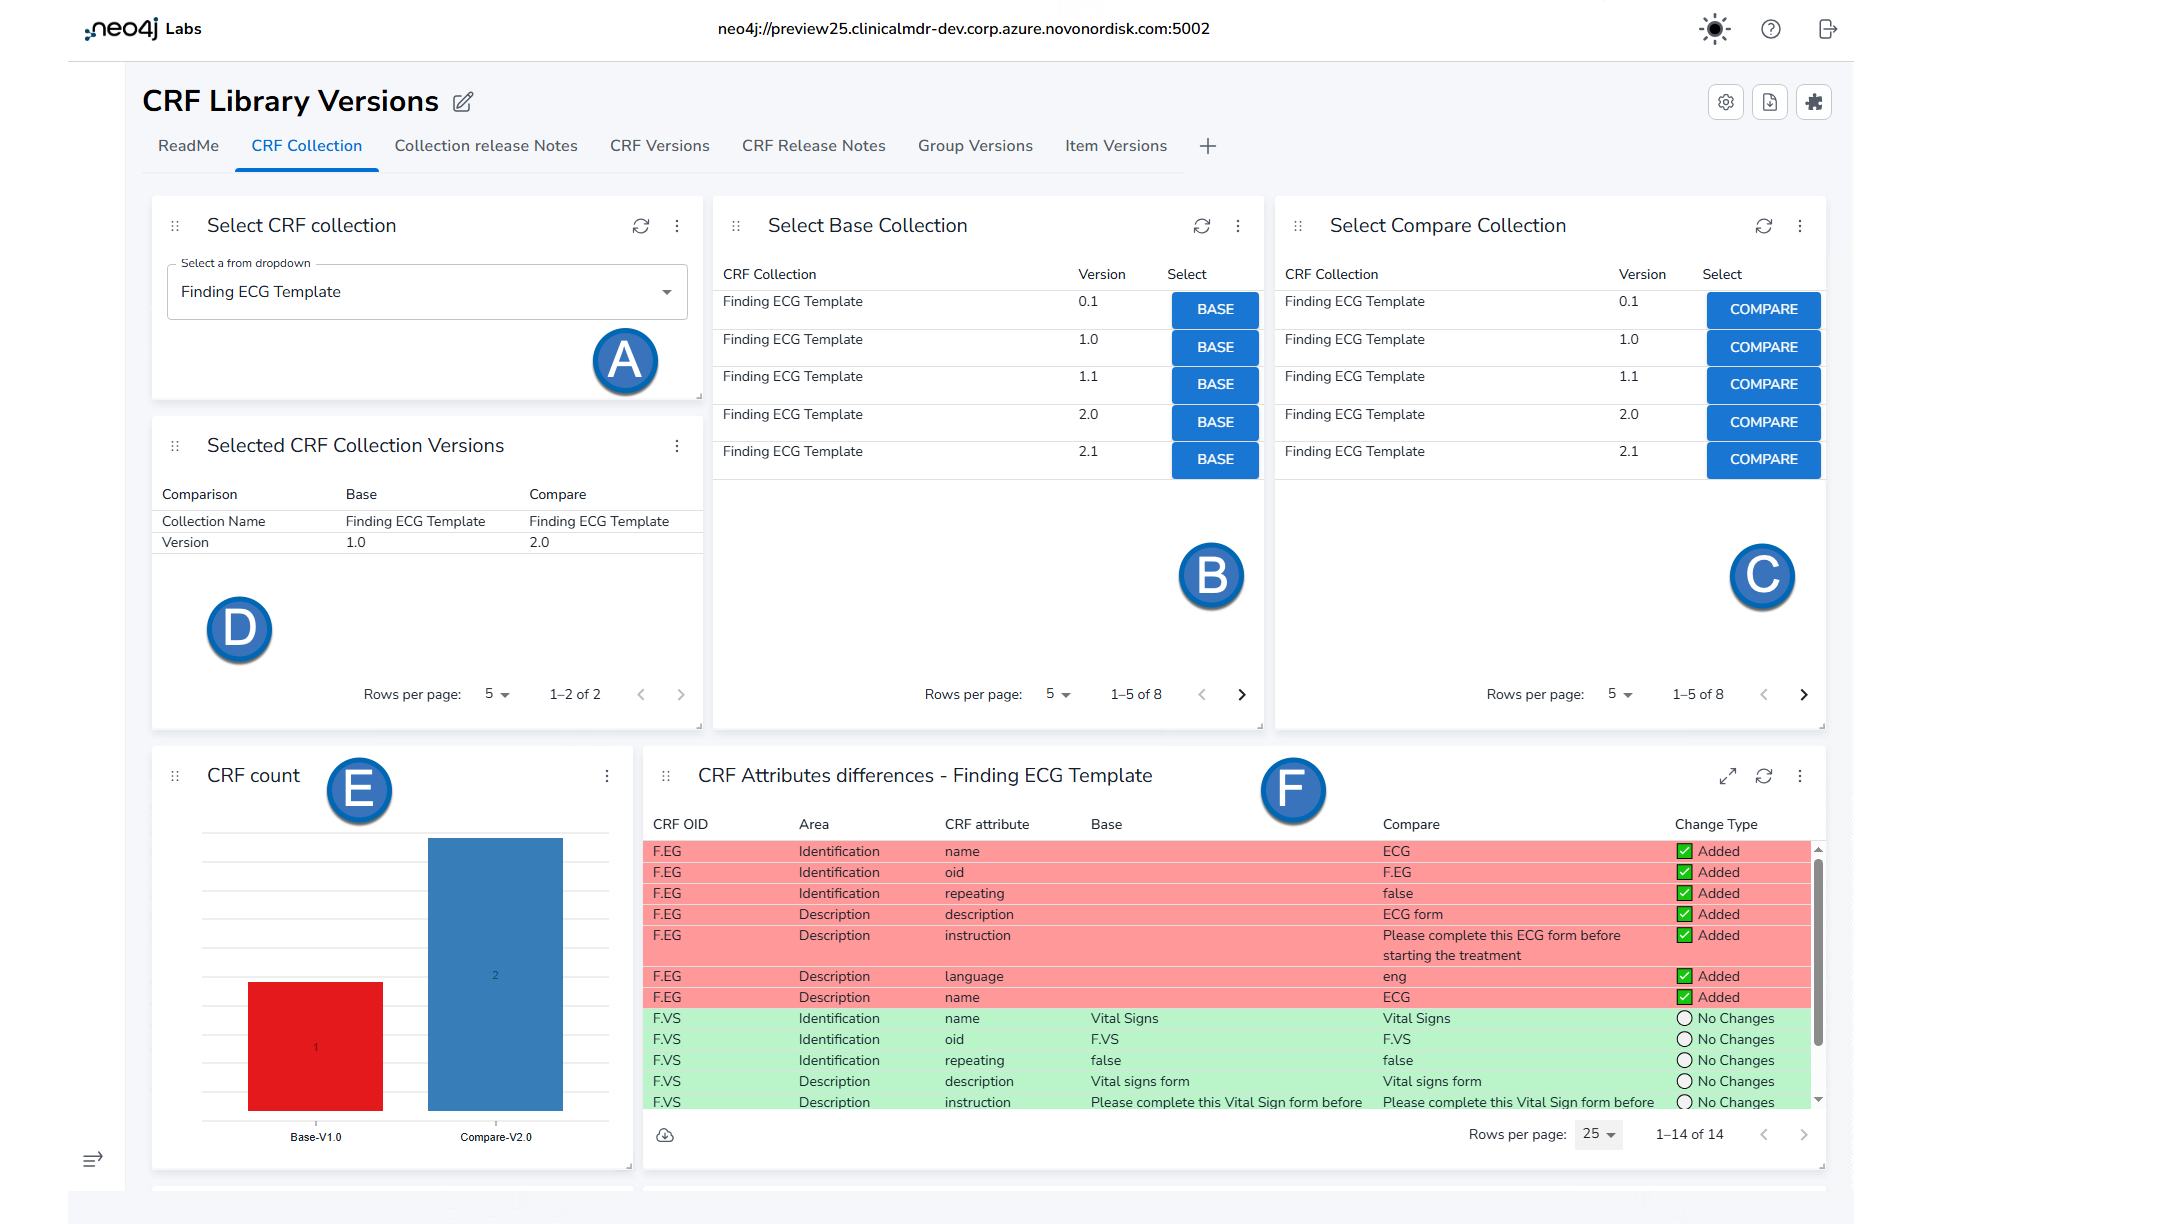
The CRF Collection tab showing selection dropdowns (A), version selection tables (B, C), selected versions summary (D), and CRF count visualization (E)
Select a CRF collection (A) - Use the dropdown to select the CRF collection you want to compare.
Select Base Collection (B) - Choose the base version from the table by clicking on the "Select" column. This sets the baseline for comparison.
Select Compare Collection (C) - Choose the comparison version from the table by clicking on the "Select" column.
Selected CRF Collection Versions (D) - View a summary of your selected base and compare versions.
CRF count (E) - Visual bar chart showing the number of CRFs in each selected version.
CRF Attributes differences (F) - Table displaying differences in CRF attributes between the two versions. Rows are color-coded:
- Green background indicates no changes
- Red background indicates differences (Added, Removed, or Modified)
The table shows various attribute areas including:
- Identification attributes (OID, name, repeating)
- Description attributes
- Alias attributes
- Attribute Vendor Extensions
- Element Vendor Extensions
- Attribute Vendor Extension NameSpaces
- Element Vendor Extension NameSpaces
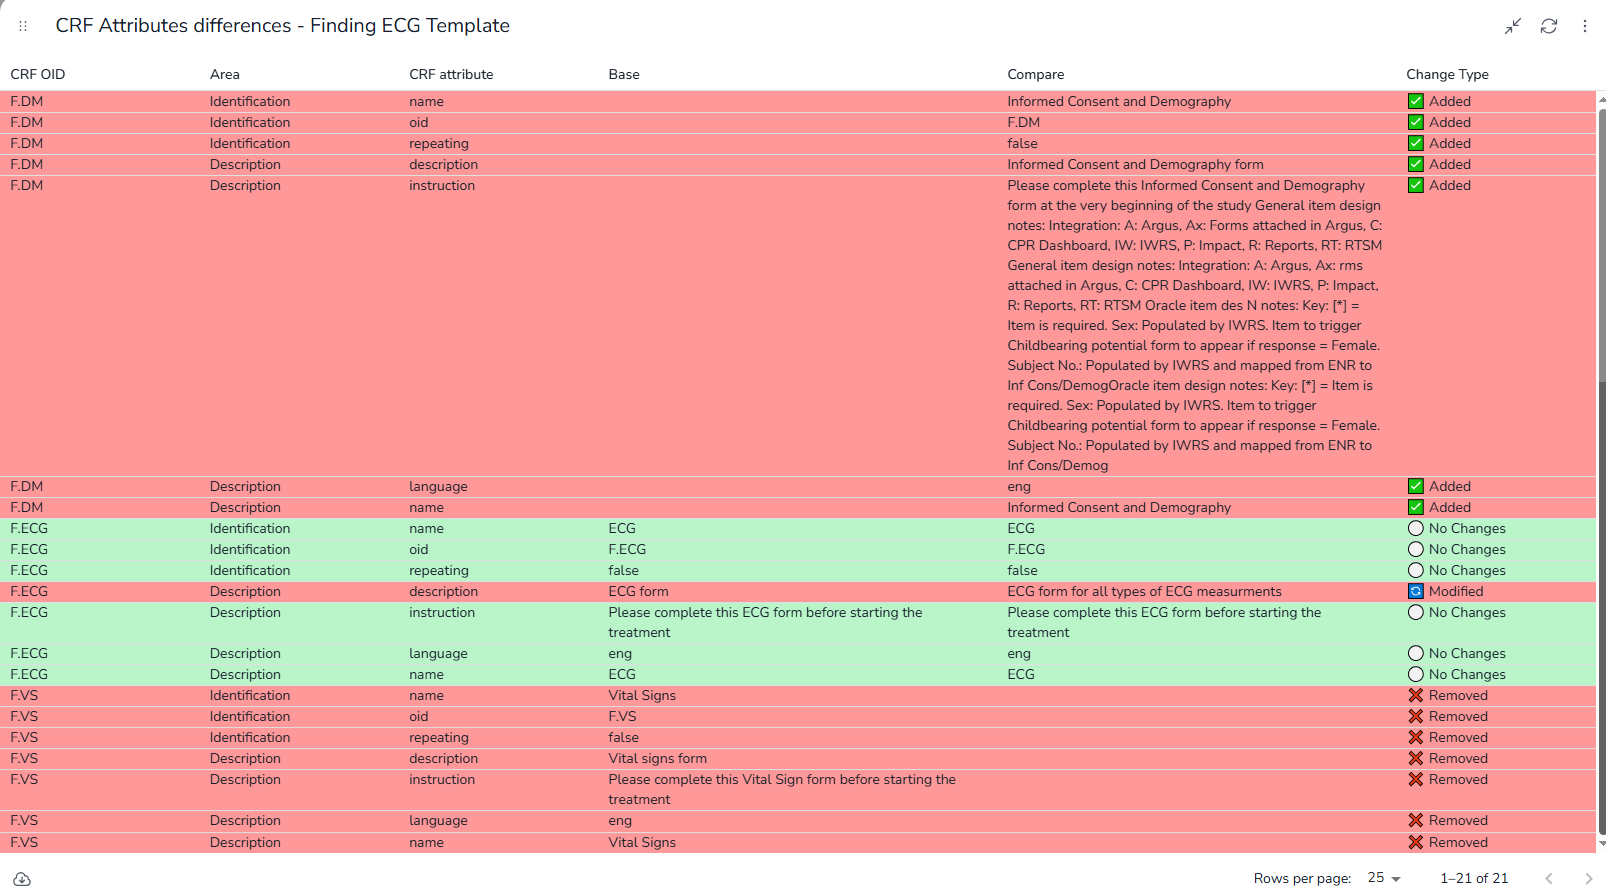
CRF attributes differences table showing color-coded rows with green for unchanged attributes and red for differences. The table displays various attribute areas including Identification, Description, Alias, and Vendor Extensions
Change Type indicators used throughout:
- ⚪ No Changes - Attribute values are identical
- ✅ Added - Attribute exists only in Compare version
- ❌ Removed - Attribute exists only in Base version
- 🔄 Modified - Attribute exists in both but with different values
To drill further down you can select a specific CRF.
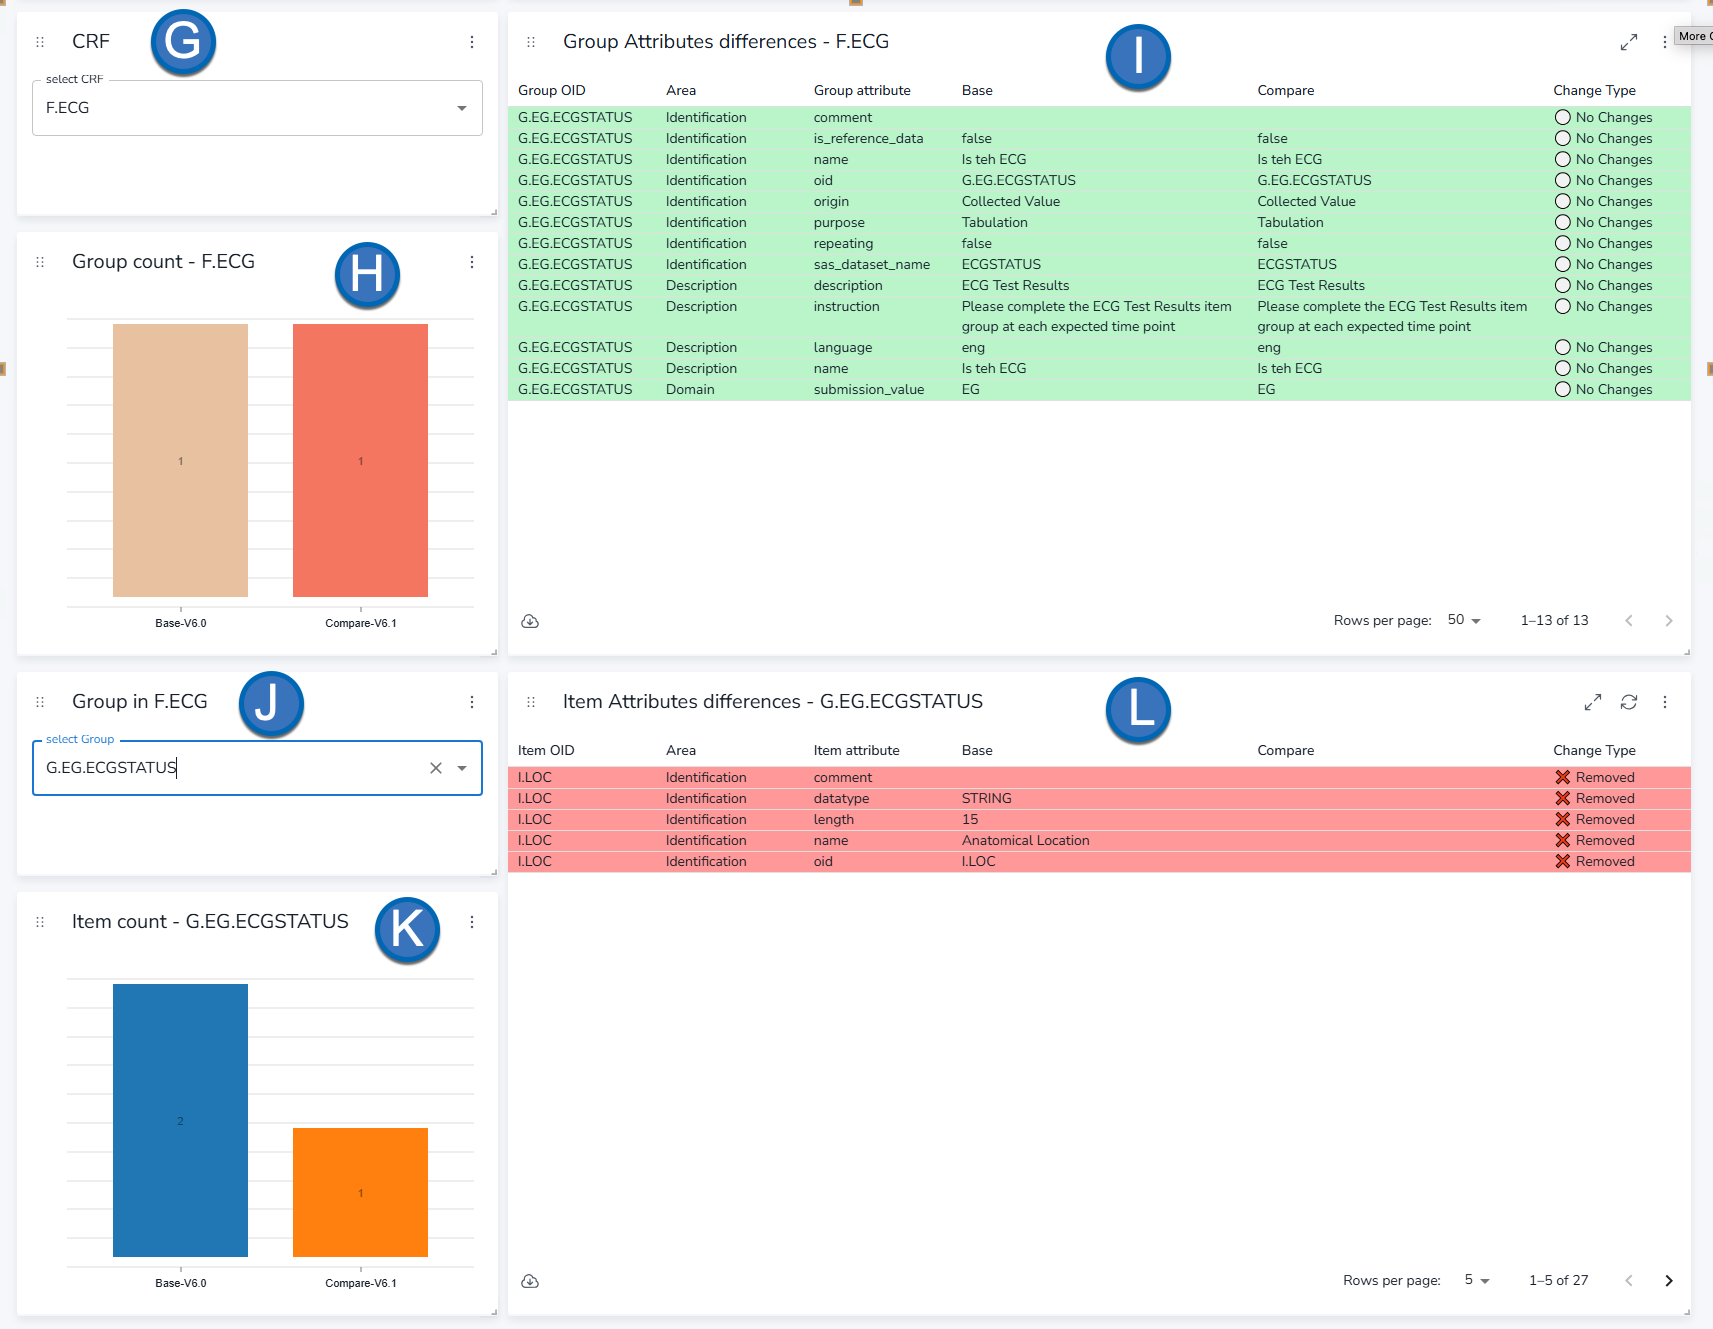
The drill-down in the Collection. Selecting CRF (G), Group Count in CRF selected (H), Group Attribute differences (I), Selecting Group (in selected CRF) (J), Item Count in selected Group (K), Item Attribute differences (in selected Group) (L)
Select CRF (G) - Dropdown to select a specific CRF within the collection for detailed comparison.
Group count (H) - Visual bar chart showing the number of Groups in the selected CRF for each version.
Group Attributes differences (I) - Table displaying differences in Group attributes for the selected CRF. The table includes:
- Group OID
- Area (Identification, Description, Alias, Domain, Vendor Extensions)
- Group attributes and their values in Base and Compare versions
- Change Type indicators
Note: If a CRF has no Groups, the table will display "No Groups in the Form".
Select Group (J) - Dropdown to select a specific Group within the CRF for detailed comparison.
Item count (K) - Visual bar chart showing the number of Items in the selected Group for each version.
Item Attributes differences (L) - Table displaying differences in Item attributes for the selected Group. The table includes:
- Item OID
- Area (Identification, Description, Alias, Terms, Vendor Extensions)
- Item attributes and their values in Base and Compare versions
- Change Type indicators
Note: If a Group has no Items, the table will display "No Items in the Group".
# Collection release Notes
This tab provides a consolidated view of all changes between two collection versions, ideal for generating release documentation.
The main table displays all changes across CRFs, Groups, and Items with the following information:
- CRF OID - The identifier of the CRF
- Level - Whether the change is at CRF, Group, or Item level
- Group OID - The identifier of the Group (if applicable)
- Item OID - The identifier of the Item (if applicable)
- Attribute - The specific attribute that changed
- Change Type - Type of change (No Changes, Added, Removed, Modified)
- Base Value - Value in the base version
- Compare Value - Value in the compare version
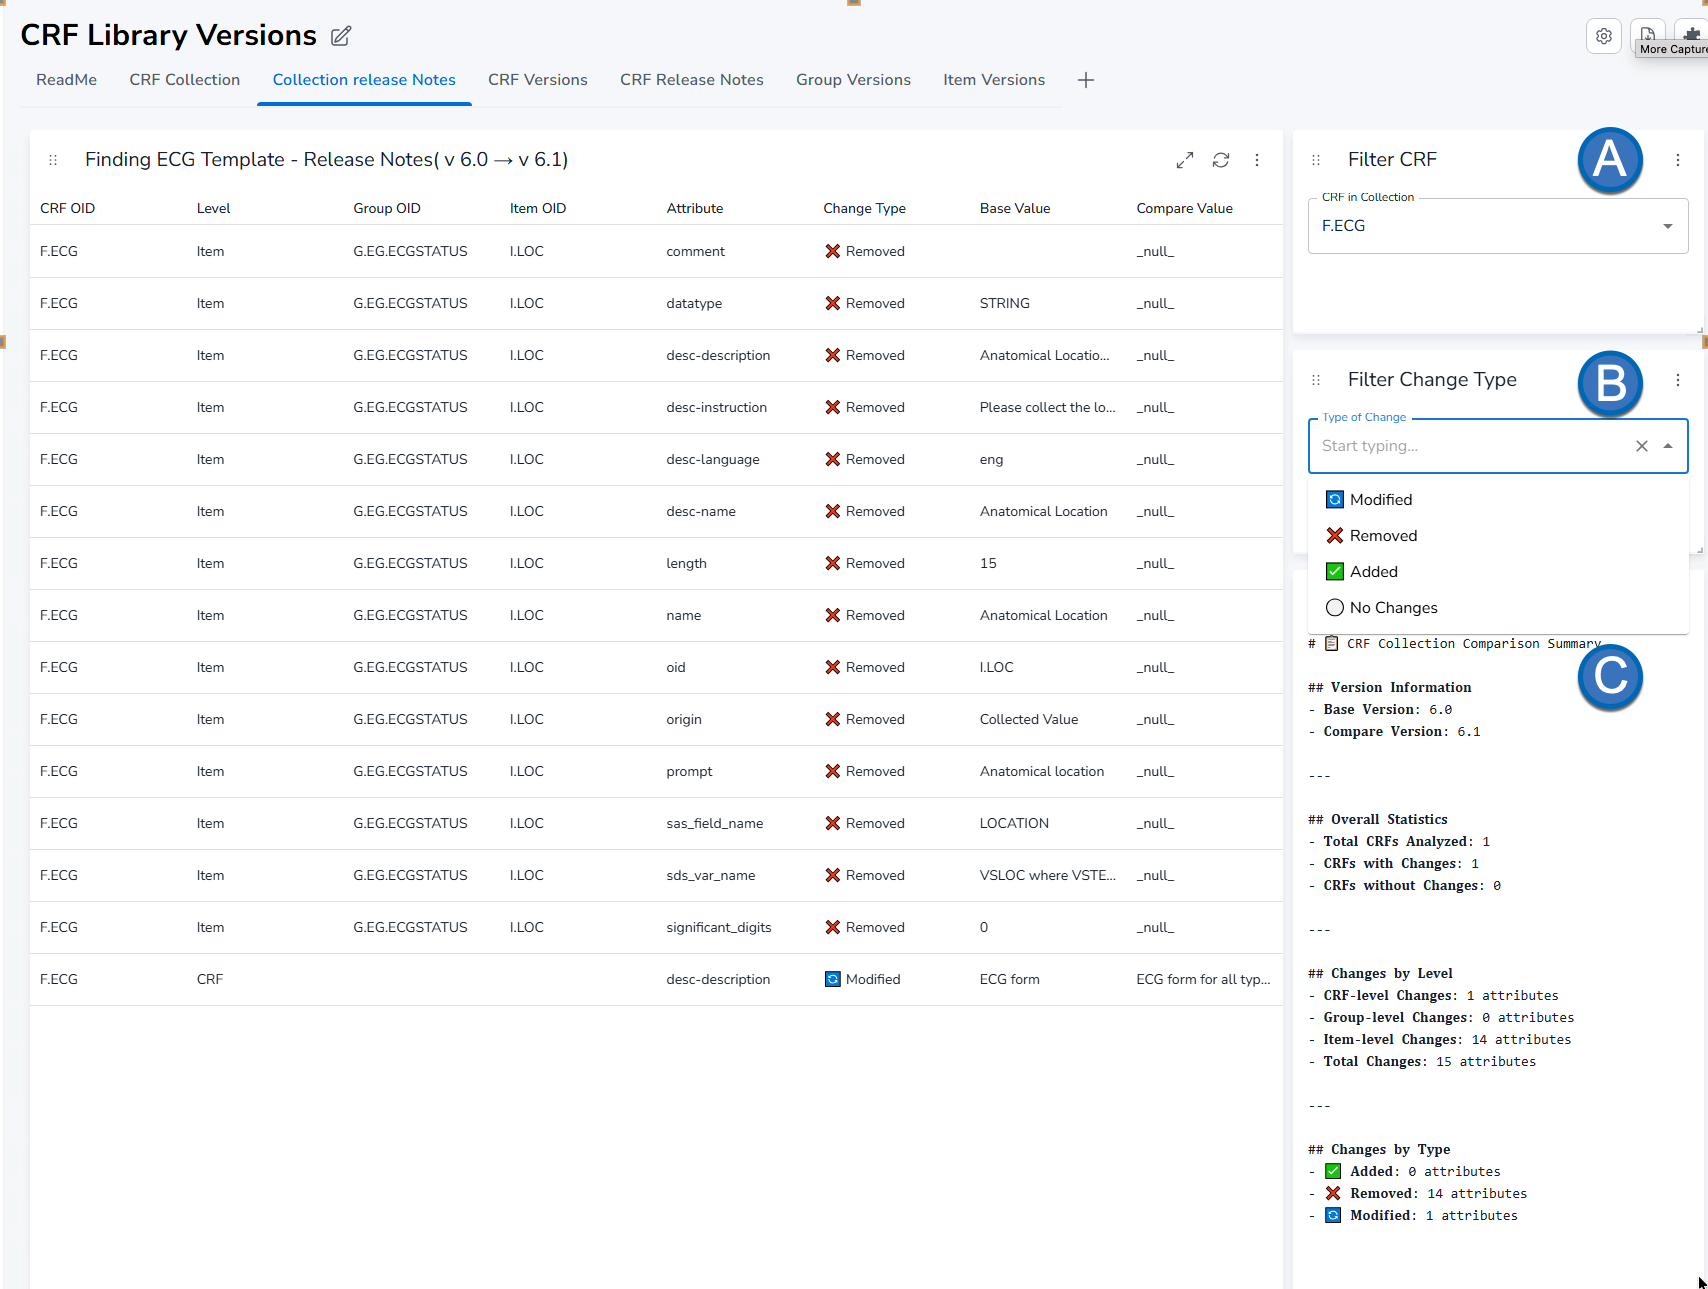
Collection release notes displaying all changes across CRFs, Groups, and Items with filtering options and summary statistics
Note: Before using this tab, you must first select the Base and Compare collection versions on the CRF Collection tab.
Filtering options:
Filter CRF (A) - Dropdown to filter the results to a specific CRF within the collection.
Filter Change Type (B) - Dropdown to filter by type of change:
- ⚪ No Changes
- ✅ Added
- ❌ Removed
- 🔄 Modified
Summary (C) - Displays summary statistics about the comparison:
- Total number of changes
- Breakdown by change type
- Counts at each level (CRF, Group, Item)
Note: CRFs with no changes will show a single row with status "No changes" for easy identification of unchanged CRFs.
The release notes view is useful for:
- Generating documentation for version updates
- Reviewing the scope of changes before promoting a collection version
- Communicating changes to stakeholders
- Quality review of collection modifications
# CRF Versions
This tab takes a CRF-focused approach, allowing you to compare different versions of a specific CRF regardless of which collection it belongs to. This is useful when you want to track how a CRF has evolved over time across different collections.
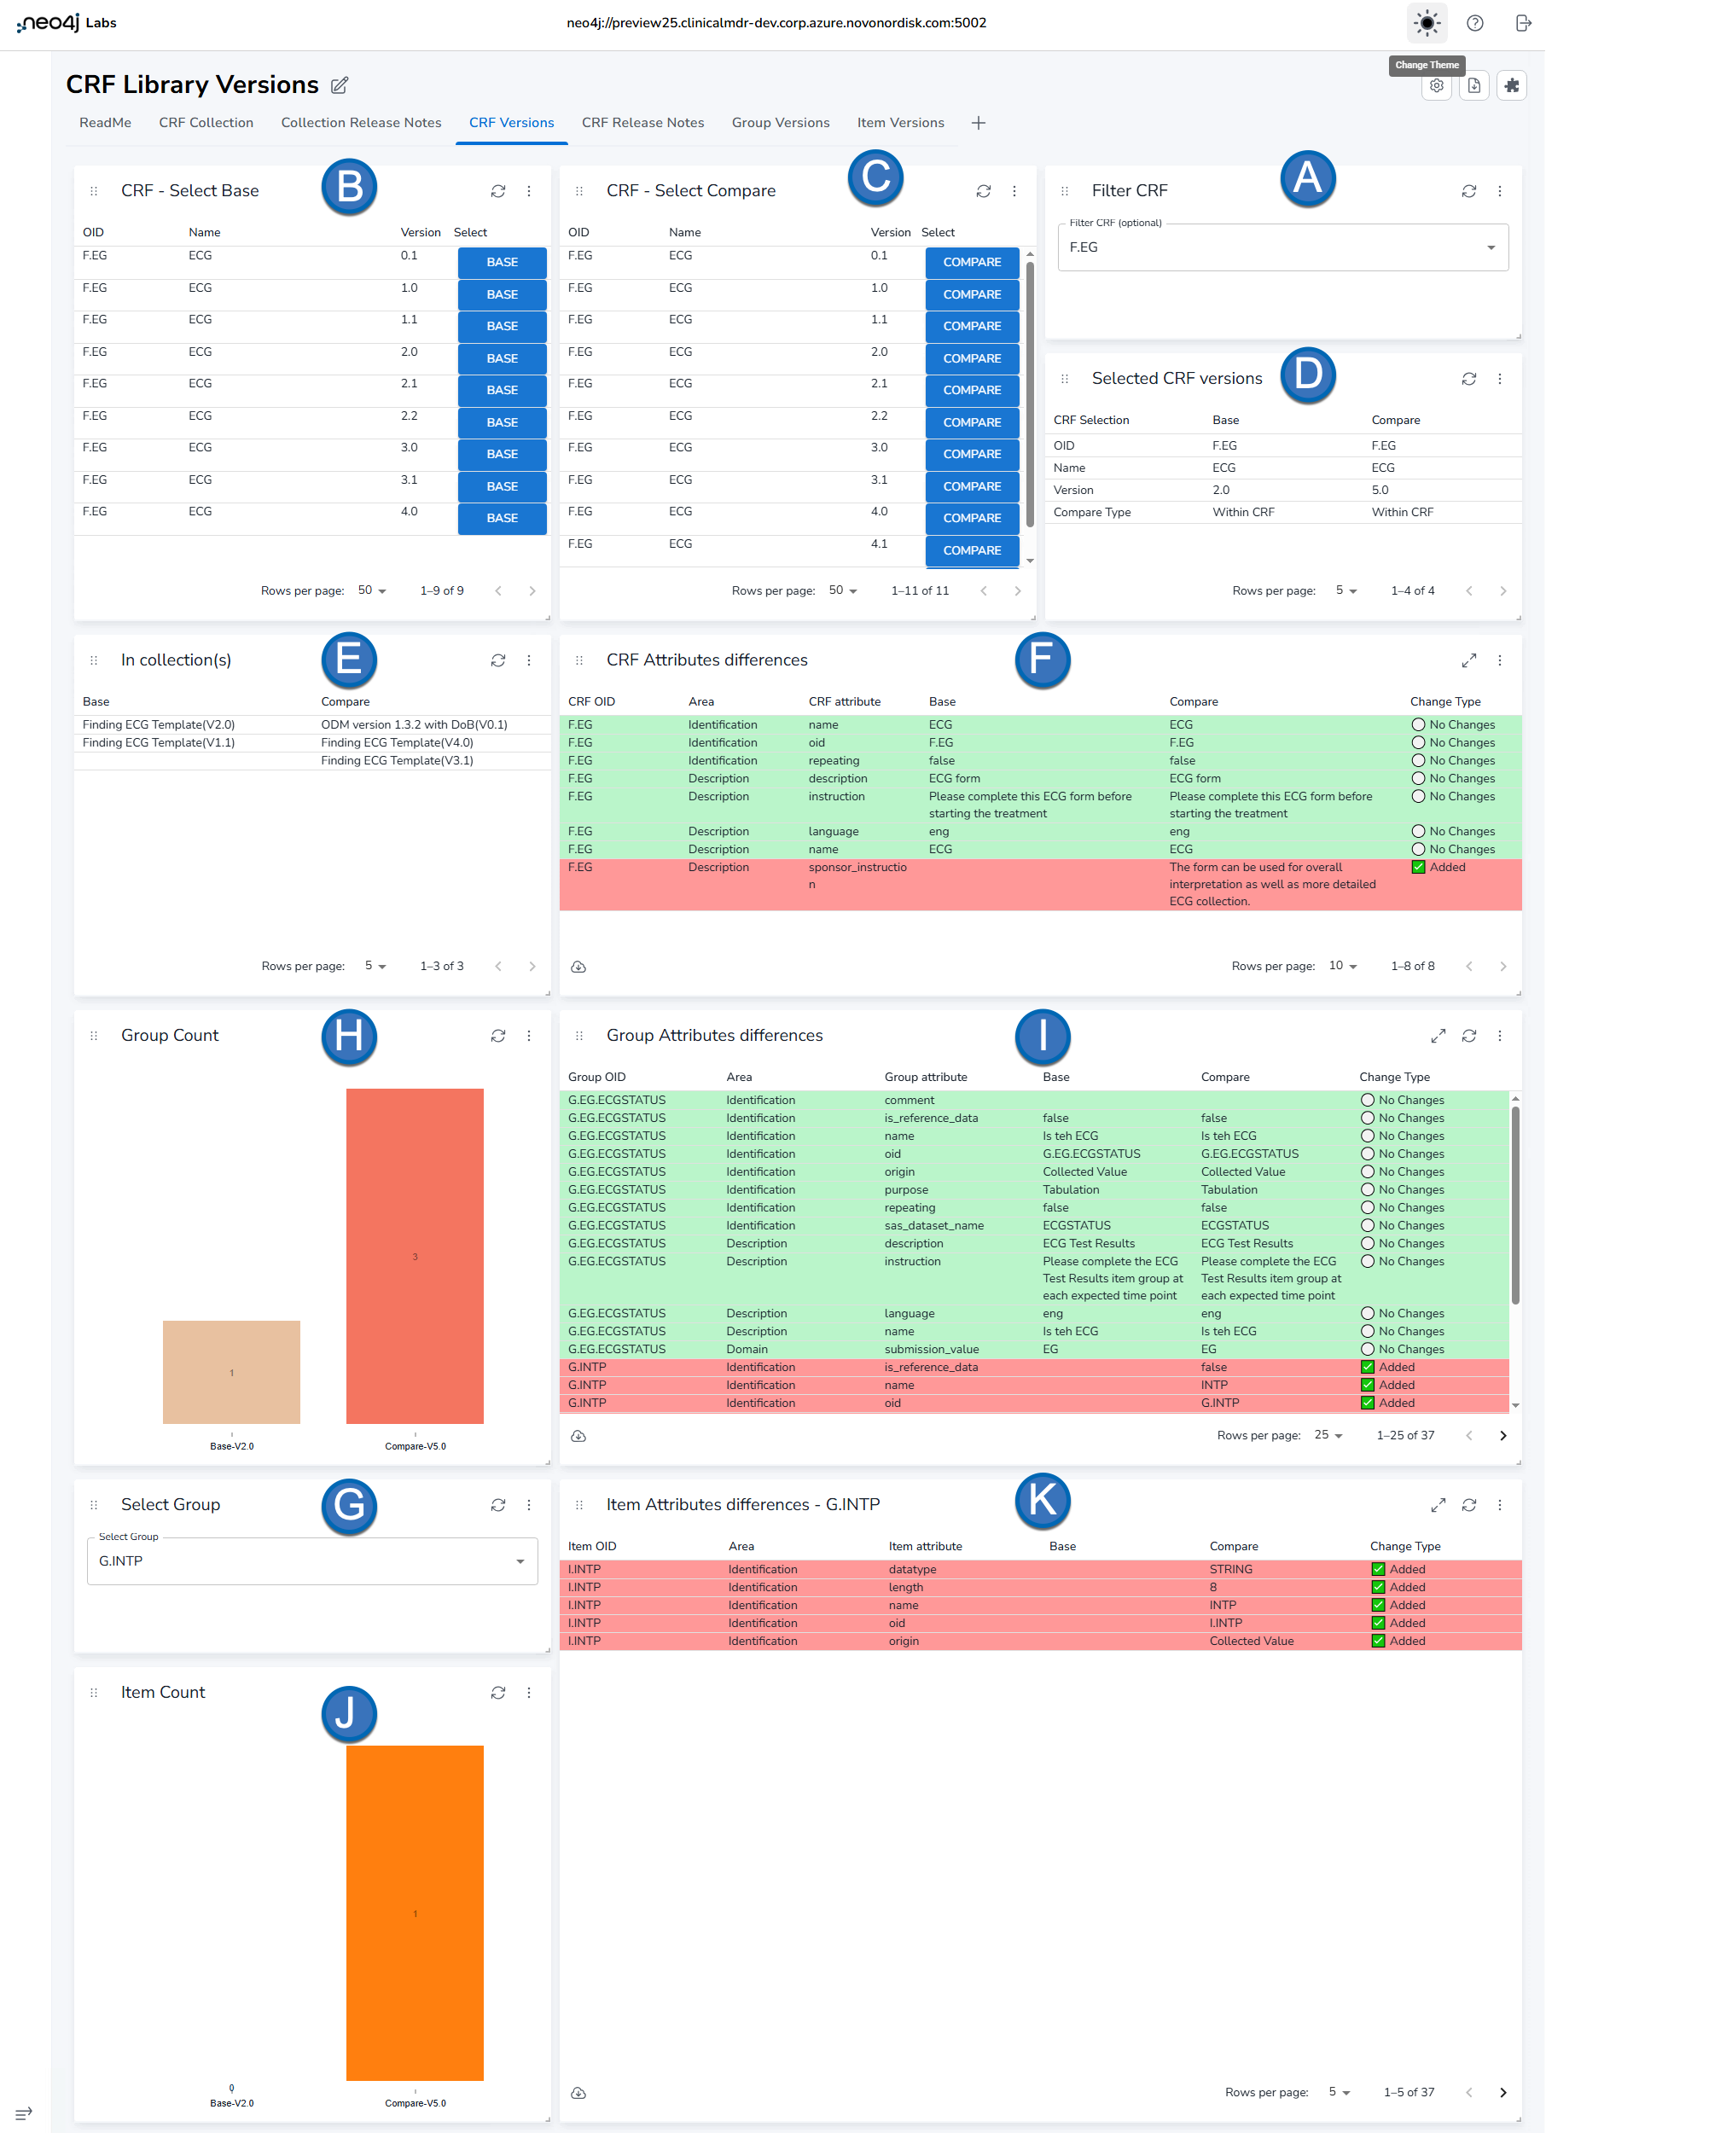
The CRF Versions tab showing CRF selection (A), base and compare version selection (B, C), collections containing each version (E), and attribute differences (F)
Select a CRF (A) - Use the dropdown to select the CRF you want to analyze. The dropdown allows searching by CRF OID or name.
Select Base CRF Version (B) - Choose the base version from the table by clicking on the "Select" column. The table displays:
- CRF Name
- Version number
- Selection button
Select Compare CRF Version (C) - Choose the comparison version from the table by clicking on the "Select" column.
Selected CRF Versions (D) - View a summary of your selected base and compare versions, including:
- CRF OID
- Version numbers
- Comparison type (Base/Compare)
Collections containing the CRF (E) - Table showing which CRF collections contain each version of the selected CRF. This helps you understand where each CRF version is being used.
CRF Attributes differences (F) - Table displaying differences in CRF attributes between the two selected versions. The table structure is similar to the CRF Collection tab:
- CRF OID
- Area (Identification, Description, Alias, Vendor Extensions)
- CRF attributes and their values in Base and Compare versions
- Change Type indicators (⚪ No Changes, ✅ Added, ❌ Removed, 🔄 Modified)
Rows are color-coded with green for no changes and red for differences.
Select Group on CRF (G) - Dropdown to select a specific Group within the CRF for detailed comparison.
Group count (H) - Visual bar chart showing the number of Groups in each selected CRF version.
Group Attributes differences (I) - Table displaying differences in Group attributes for the selected Group across the two CRF versions:
- Group OID
- Area (Identification, Description, Alias, Domain, Vendor Extensions)
- Group attributes and their values
- Change Type indicators
Item count (J) - Visual bar chart showing the number of Items in the selected Group for each CRF version.
Item Attributes differences (K) - Table displaying differences in Item attributes for the selected Item:
- Item OID
- Area (Identification, Description, Alias, Terms, Vendor Extensions)
- Item attributes and their values
- Change Type indicators
Note: This tab focuses on CRF versions independently of collections, making it easier to track the evolution of a specific CRF design across different contexts.
# CRF Release Notes
This tab provides a consolidated release notes view for CRF version comparisons, similar to the Collection release Notes tab but focused on individual CRF versions rather than entire collections.
Note: Before using this tab, you must first select the Base and Compare CRF versions on the CRF Versions tab.
Main Display:
The main table (A) displays all changes across the selected CRF versions at the CRF, Group, and Item levels with the following columns:
- CRF OID - The identifier of the CRF being compared
- Level - Whether the change is at CRF, Group, or Item level
- Group OID - The identifier of the Group (if applicable)
- Item OID - The identifier of the Item (if applicable)
- Attribute - The specific attribute that changed
- Change Type - Type of change:
- ⚪ No Changes - Attribute values are identical
- ✅ Added - Attribute exists only in Compare version
- ❌ Removed - Attribute exists only in Base version
- 🔄 Modified - Attribute exists in both but with different values
- Base Value - Value in the base version
- Compare Value - Value in the compare version
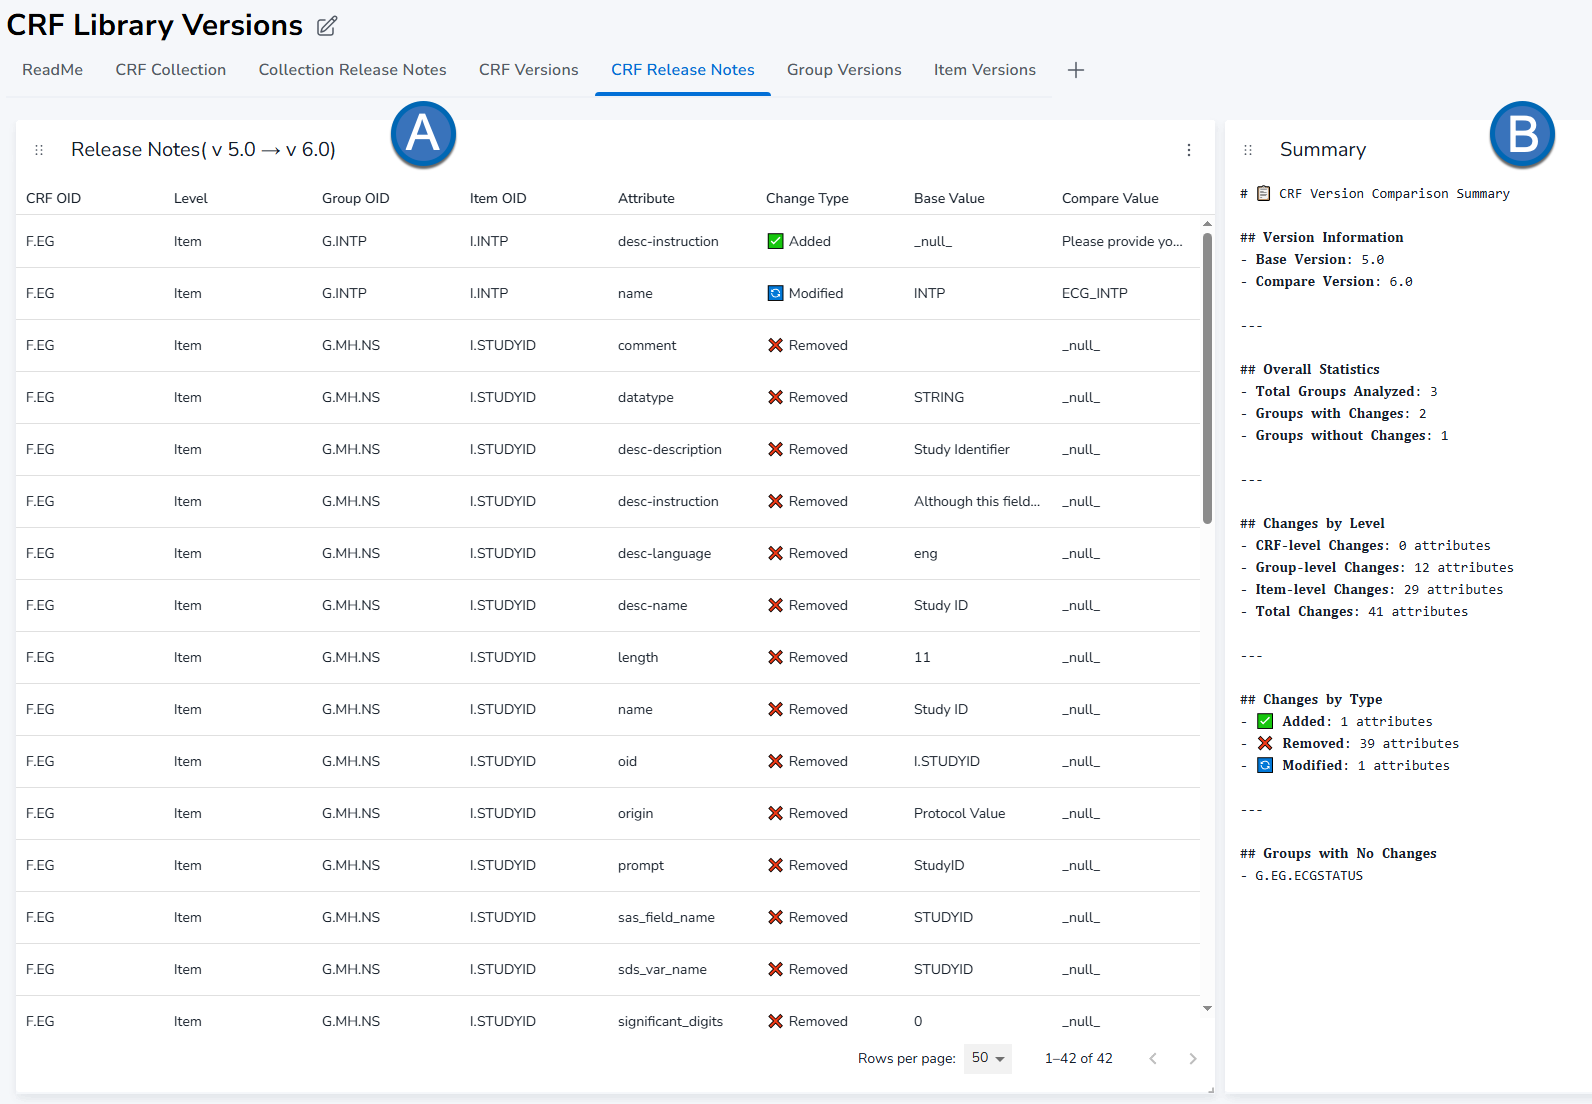
CRF release notes view (A) and summary statistics (B) showing the breakdown of changes
- Summary Statistics (B) - Displays summary information about the comparison:
- Total number of changes detected
- Breakdown by change type (Added, Removed, Modified)
- Count of changes at each level (CRF, Group, Item)
The CRF Release Notes view is useful for:
- Documenting CRF version updates
- Understanding the scope of changes between CRF versions
- Tracking design evolution of specific CRFs
- Supporting quality review processes
# Group Versions
This tab takes a Group-focused approach, allowing you to compare different versions of a specific Group (Item Group) regardless of which CRF or collection it belongs to. This is useful for tracking how a reusable Group component has evolved over time.
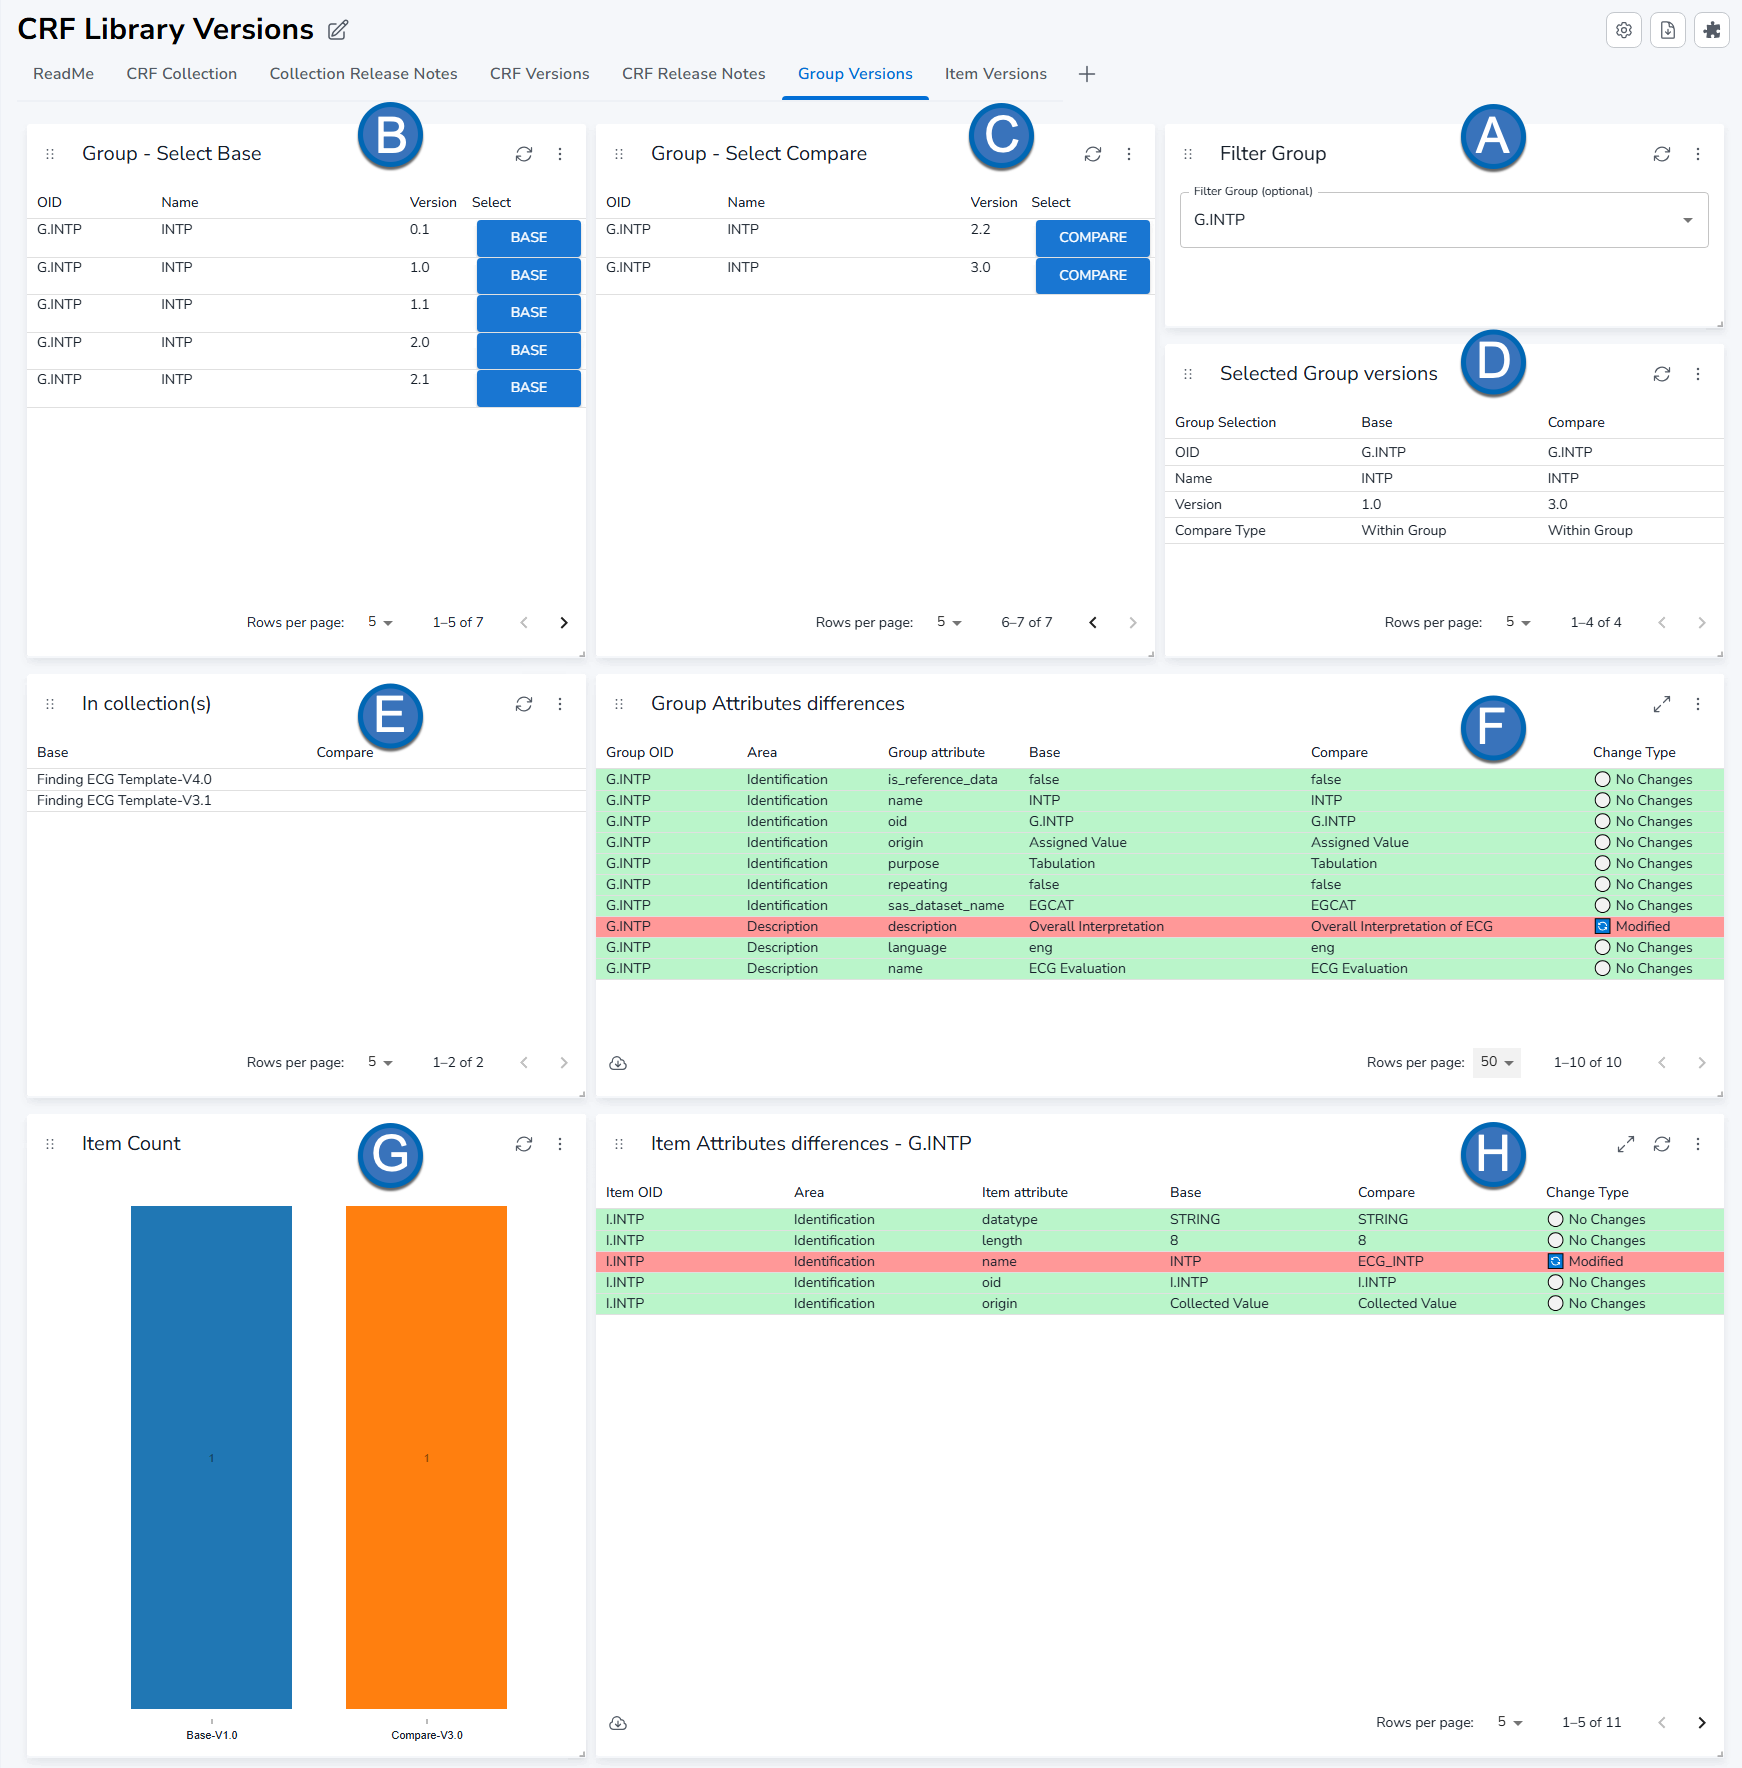
The Group Versions tab showing Group selection (A), version comparison tables (B, C), and the hierarchy showing which Collections and CRFs contain each Group version
Select a Group (A) - Use the dropdown to select the Group you want to analyze. The dropdown allows searching by Group OID or name.
Select Base Group Version (B) - Choose the base version from the table by clicking on the "Select" column. The table displays:
- Group Name
- Version number
- Selection button
Select Compare Group Version (C) - Choose the comparison version from the table by clicking on the "Select" column.
Selected Group Versions (D) - View a summary of your selected base and compare versions, including:
- Group OID
- Version numbers
- Comparison type (Base/Compare)
Collections and CRFs containing the Group (E) - Table showing which CRF collections and CRFs contain each version of the selected Group. This provides context about where the Group is being used:
- Collection name
- CRF name
- Group version
Group Attributes differences (F) - Table displaying differences in Group attributes between the two selected versions:
- Group OID
- Area (Identification, Description, Alias, Domain, Vendor Extensions)
- Group attributes and their values in Base and Compare versions
- Change Type indicators (⚪ No Changes, ✅ Added, ❌ Removed, 🔄 Modified)
Rows are color-coded with green for no changes and red for differences.
Item count (G) - Visual bar chart showing the number of Items in each selected Group version.
Item Attributes differences (H) - Table displaying differences in Item attributes for the selected Item across the two Group versions:
- Item OID
- Area (Identification, Description, Alias, Terms, Vendor Extensions)
- Item attributes and their values
- Change Type indicators
Note: This tab is particularly useful for understanding how reusable Group components have evolved across different CRF designs and collections.
# Item Versions
This tab takes an Item-focused approach, allowing you to compare different versions of a specific Item regardless of which Group, CRF, or collection it belongs to. This is the most granular level of comparison available in the report, useful for tracking how individual data points have evolved over time.
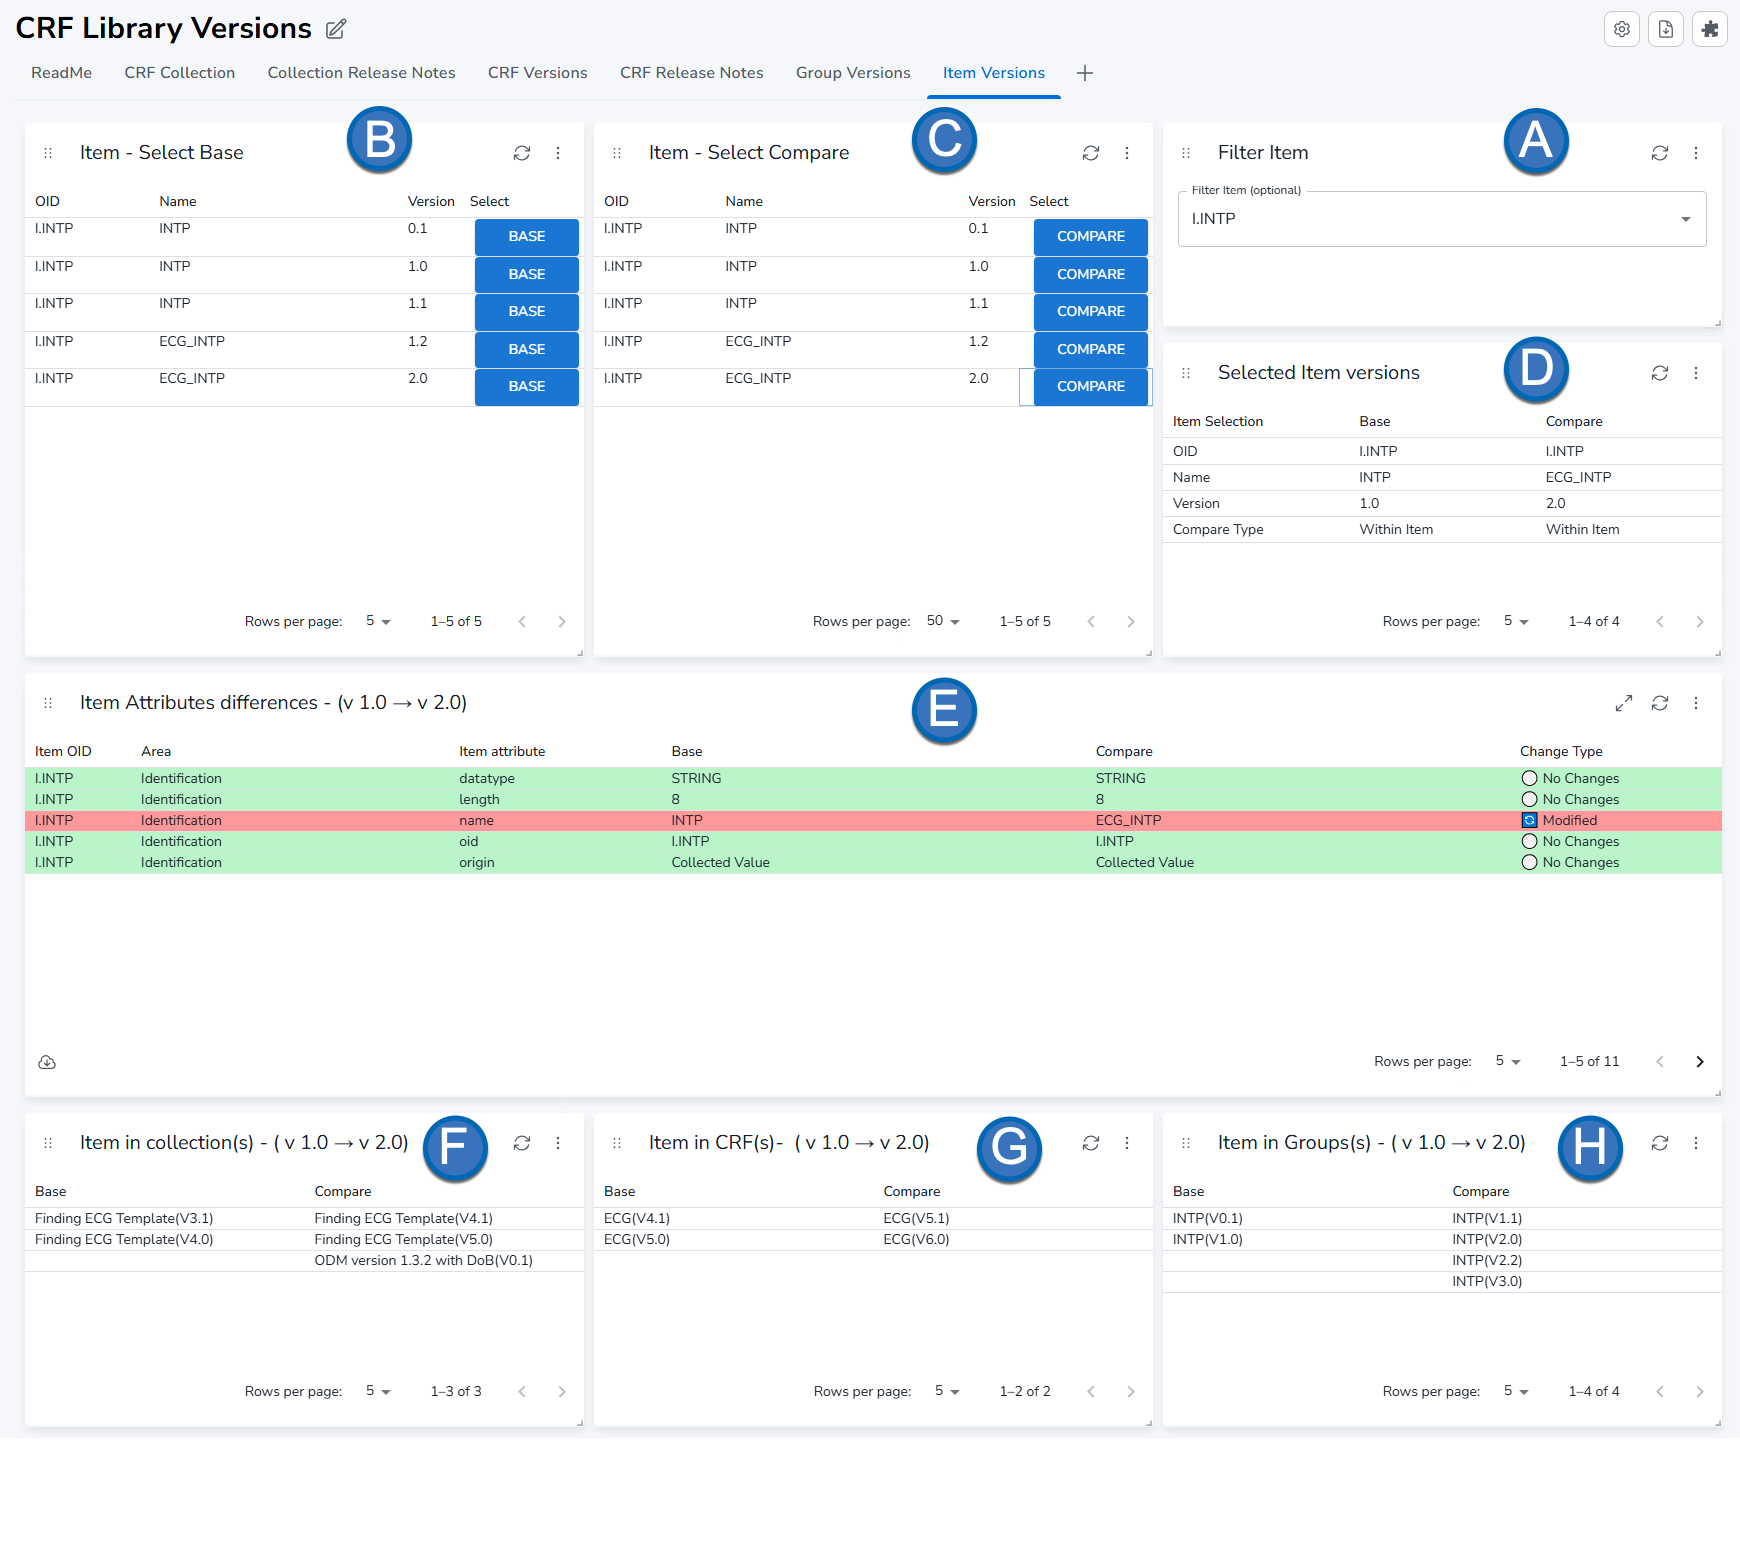
The Item Versions tab displaying Item selection (A), version comparison (B, C), and the complete hierarchy (E) showing Collections, CRFs, and Groups containing the Item
Select an Item (A) - Use the dropdown to select the Item you want to analyze. The dropdown allows searching by Item OID or name.
Select Base Item Version (B) - Choose the base version from the table by clicking on the "Select" column. The table displays:
- Item Name
- Version number
- Selection button
Select Compare Item Version (C) - Choose the comparison version from the table by clicking on the "Select" column.
Selected Item Versions (D) - View a summary of your selected base and compare versions, including:
- Item OID
- Version numbers
- Comparison type (Base/Compare)
Item Attributes differences (E) - Table displaying differences in Item attributes between the two selected versions:
- Item OID
- Area (Identification, Description, Alias, Terms, Vendor Extensions)
- Item attributes and their values in Base and Compare versions
- Change Type indicators (⚪ No Changes, ✅ Added, ❌ Removed, 🔄 Modified)
The table includes all Item-level attributes such as:
- Identification attributes (OID, name, data type, length, significant digits)
- Description attributes
- Alias attributes
- Codelist terms and submission values
- Vendor attribute extensions
- Vendor element extensions
Rows are color-coded with green for no changes and red for differences.
Collections, CRFs, and Groups containing the Item (F,G,H) - Table showing the complete hierarchy of where each version of the selected Item is being used:
- Collection name (F)
- CRF name (G)
- Group name (H)
This provides full context about the Item's usage across the entire CRF library structure.
Note: This tab is particularly useful for:
- Tracking changes to individual data collection points
- Understanding how controlled terminology assignments have changed
- Reviewing data type or validation rule modifications
- Analyzing the impact of Item definition changes across multiple contexts->
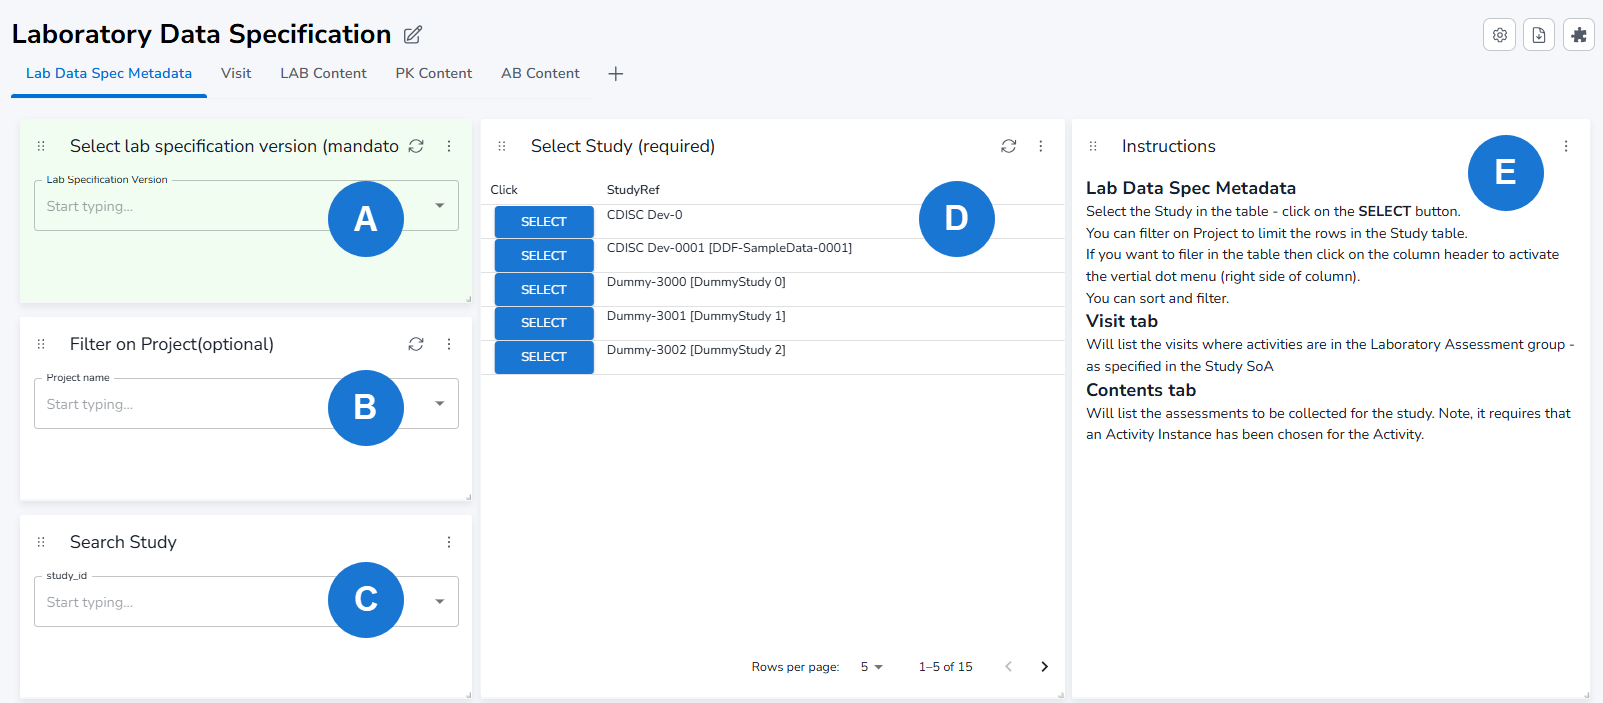
# Laboratory Data Specification
The purpose of this report is to help create a Laboratory Data Specification document that facilitates the delivery of data from a supplier by describing the required data file structure and content.
Reports consist of the following tabs:
Lab Data Spec Metadata — serves as the landing page. The user must select a lab specification version (A). Based on the selected version, the appropriate structure and column names are defined in the other report tabs. The second task is to select the study by clicking on SELECT button (D). If the study list in section D is too long, you can narrow it by specifying the project name (B) to which the trial belongs. Alternatively, you may search for the study by its id (C). Section E displays high-level instructions on how to use the report.
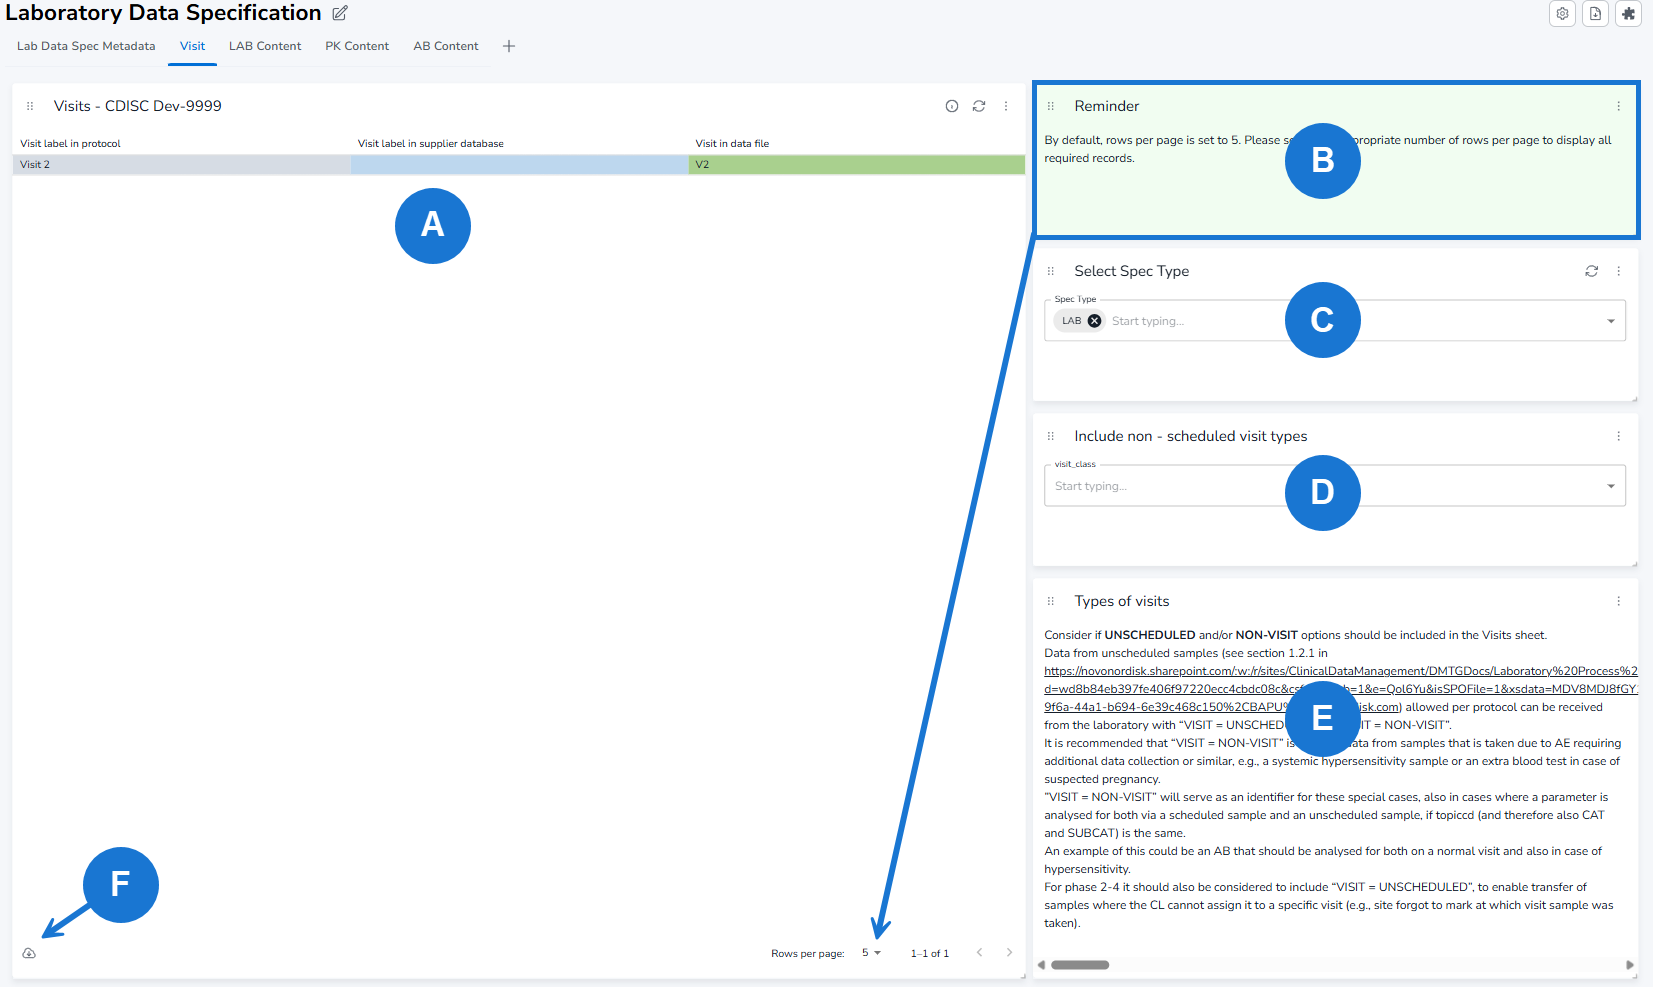
Visit — Select which visits to display: those associated with LAB, PK, or AB (C). The main left part of the page shows these visits (A). They are visits linked to activity–activity instance pairs for LAB, PK, or AB assessments as defined at the study level on the Data Specification page. See reminder B, which explains that in all reports rows per page are set to 5 by default – please change that value as needed to display more visits in the table. If samples are expected to be collected outside regular visits, you may add UNSCHEDULED and/or NON VISIT to the visits list table by clicking the D window. Explanations of when UNSCHEDULED and NON VISIT should be used are in section E. Visit table may be exported to a .csv file (F). Visit data can then be copied from that file and pasted into the Visits tab of the Laboratory Data Specification template document.
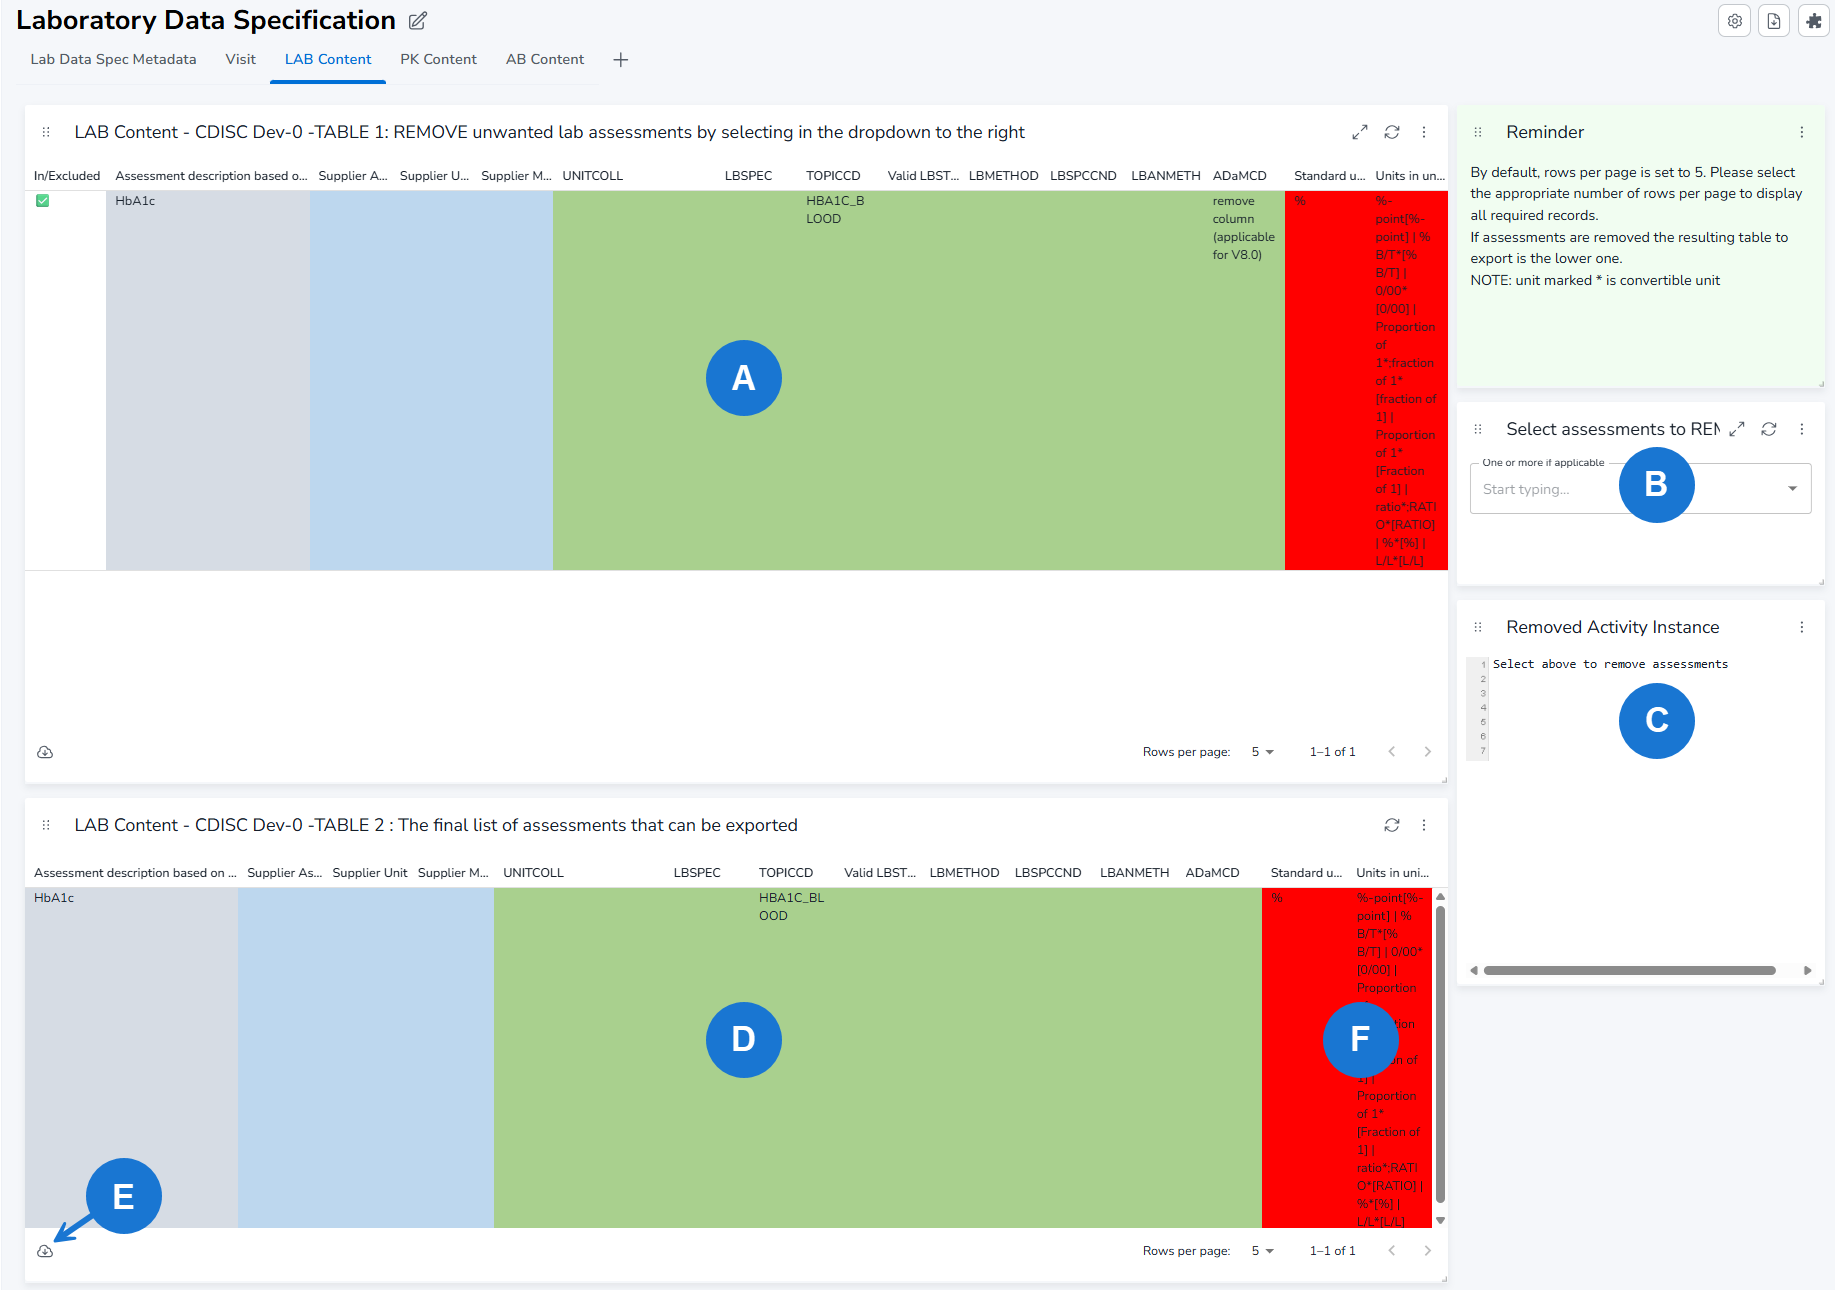
LAB content — this page contains two tables. The upper table lists all study lab assessment data except PK/PD (Pharmacokinetic/Pharmacodynamic) and ADA (Antibodies). By selecting topic codes in section B, the user can remove unwanted lab assessments from the list. Those assessments will not appear in the lower table (D). Section C displays the list of removed data, while table D shows the final data set, which can be exported to .csv (E). Two columns highlighted in red in the table (F) - Standard Unit and Units in the Units dimension [CDISC submission value] - are additional to the columns in the Laboratory Data Specification template. The purpose of these columns is to help CDP determine, based on vendor-provided input, whether selected study instances are correct.
PK content — design of this page is similar to LAB content page. PK Content displays PK (Pharmacokinetic) and PD (Pharmacodynamic) data.
AB content — design of this page is similar to LAB content page. AB contest page displays antibody assessment data.